Download
1 / 47
470 likes | 475 Views
Creating Moves to Opportunity: Experimental Evidence on Neighborhood Choice Among Housing Voucher Recipients. Peter Bergman, Columbia Raj Chetty, Harvard and NBER Stefanie DeLuca, Johns Hopkins Nathaniel Hendren, Harvard and NBER Lawrence Katz, Harvard and NBER

E N D
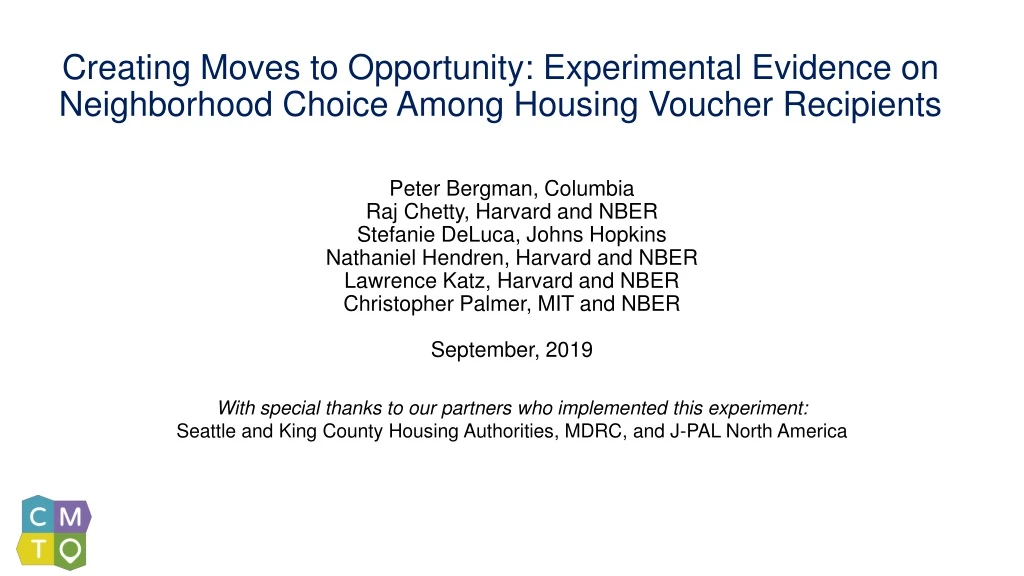
Creating Moves to Opportunity: Experimental Evidence on Neighborhood Choice Among Housing Voucher Recipients Peter Bergman, ColumbiaRaj Chetty, Harvard and NBER Stefanie DeLuca, Johns Hopkins Nathaniel Hendren, Harvard and NBER Lawrence Katz, Harvard and NBER Christopher Palmer, MIT and NBER September, 2019 • With special thanks to our partners who implemented this experiment:Seattle and King County Housing Authorities, MDRC, and J-PAL North America
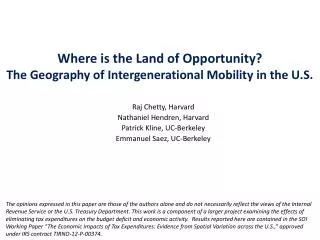
Motivation: Four Facts on Neighborhoods and Economic Opportunity • Children’s prospects for upward income mobility vary substantially across neighborhoods (and even nearby neighborhoods)
The Geography of Upward Mobility in the United States Average Household Income for Children with Parents Earning $27,000 (25th percentile) Seattle $35.2k Salt Lake City $37.2k Chicago$30.7k Cleveland $29.4k Boston $36.8k Baltimore $28.2k San Francisco Bay Area $37.2k Washington DC $33.9k > $44.8k Los Angeles $34.3k Atlanta $26.6k $33.7k < $26.8k Note: Blue = More Upward Mobility, Red = Less Upward Mobility
The Geography of Upward Mobility in Seattle Average Income at Age 35 for Children with Parents Earning $27,000 (25th percentile) North Queen Anne $44k Percentile Rank in Adulthood > 60 ($55k) Eastgate $43k Central District $26K 48 ($39k) < 30 ($20k) Source: Chetty, Friedman, Hendren, Jones, Porter (2018)
Motivation: Four Facts on Neighborhoods and Economic Opportunity • Children’s prospects for upward income mobility vary substantially across neighborhoods • Moving to better neighborhoods improves children’s (economic) outcomes in adulthood significantly in proportion to exposure and improves the health and well-being of adult movers
Estimates of Childhood Exposure Effects United States Source: Chetty, Friedman, Hendren, Jones, Porter (2018) Chicago Public Housing Demolitions MTO: Baltimore, Boston, Chicago, LA, NYC Australia Montreal, Canada Denmark Source: Deutscher (2018) Source: Laliberté (2018) Source: Chyn (AER 2018) Source: Faurschou (2018) Source: Chetty, Hendren, Katz (AER 2016)
Motivation: Four Facts on Neighborhoods and Economic Opportunity • Children’s prospects for upward income mobility vary substantially across neighborhoods • Moving to better neighborhoods earlier in childhood improves children’s outcomes in adulthood significantly • Low-income families who receive housing vouchers predominantly live in low-opportunity neighborhoods
Most Common Locations of Families Receiving Housing Vouchers 25 most common tracts where voucher holders lived before the CMTO experiment Percentile Rank in Adulthood > 60 ($55k) 48 ($39k) < 30 ($20k)
Motivation: Four Facts on Neighborhoods and Economic Opportunity • Children’s prospects for upward income mobility vary substantially across neighborhoods • Moving to better neighborhoods earlier in childhood improves children’s outcomes in adulthood significantly • Low-income families who receive housing vouchers currently live predominantly in low-opportunity neighborhoods • Differences in rent only partially explain why low-income families live in low-opportunity areas
60 50 with Low-Income Parents ($1000) Average Incomes of Children 40 30 20 500 1000 1500 2000 2500 Median 2-Bedroom Rent in 2015 The Price of Opportunity in Seattle and King County Upward Mobility versus Median Rent by Neighborhood
60 50 North Queen Anne with Low-Income Parents ($1000) Average Incomes of Children 40 30 Central District 20 500 1000 1500 2000 2500 Median 2-Bedroom Rent in 2015 The Price of Opportunity in Seattle and King County Upward Mobility versus Median Rent by Neighborhood Opportunity Bargains
Question: Why Don’t Low-Income Families Move to Opportunity? • Two classes of explanations: • Preferences: families may prefer to stay in current neighborhoods because of other amenities (e.g., commute time, proximity to family) • Barriers: families may be unable to find housing in high-opportunity areas because of lack of information, search frictions, or landlords’ tastes • If barriers are what is driving segregation, can we reduce them through changes in affordable housing policy?
Creating Moves to Opportunity in Seattle and King County Randomized trial to develop and test policy-scalable strategies to reduce barriers housing choice voucher recipients face in moving to high-opportunity areas in Seattle and King County
Definition of Opportunity Areas • Intervention focuses on families with young children (1+ child below age 15) • Therefore, use Opportunity Atlas to define “opportunity areas” as places where historically children from low income families have had the highest upward mobility • Starting point: Census tracts in top third of distribution within Seattle (SHA) and King County (KCHA) • Adjust definitions in collaboration with housing authorities to account for two issues: • Neighborhood change (using test score data to assess stability) • Creating contiguous areas
Shoreline Designation of High-Opportunity Neighborhods Cottage Lake Lake City Inglewood Seattle City Boundary High-Opportunity Area Northeast Seattle Redmond Magnolia Central District Bellevue Rainier Valley West Seattle Cougar Mountain Issaquah Newport Burien Tukwila East Hill Des Moines Kent Lea Hill, Auburn
Treatment Interventions SHORT-TERM FINANCIAL ASSISTANCE CUSTOMIZED SEARCH ASSISTANCE DIRECT LANDLORD ENGAGEMENT On average, non-profit staff spend 6.3 hours with each household Average financial assistance of $1,100 for security deposits, application fees, etc. 52% of rentals in high-opportunity areas made through links via non-profit staff Program Cost: $2,600 per family issued a voucher(2.2% of average voucher payments over 7 years) Note: Families not required to move to high-opportunity areas
Fraction of Families Who Leased Units in High Opportunity Areas 60 50 40 30 to High Opportunity Areas Share of Households Who Have Moved 20 10 0 Control Treatment
Fraction of Families Who Leased Units in High Opportunity Areas 60 50 40 30 to High Opportunity Areas Share of Households Who Have Moved 20 Historical mean rate: 11.6% 10 0 Control Treatment
Fraction of Families Who Leased Units in High Opportunity Areas 60 50 40 30 to High Opportunity Areas Share of Households Who Have Moved 20 Historical mean 14.3% rate: 11.6% 10 0 Control Treatment
Fraction of Families Who Leased Units in High Opportunity Areas 60 54.3% 50 40 30 to High Opportunity Areas Share of Households Who Have Moved 20 Historical mean 14.3% rate: 11.6% 10 0 Control Treatment Difference: 40.0 pp SE: (5.2)
Fraction Who Has Leased Any Unit within Six Months of Voucher Issuance
Destination Locations for Families that Leased Units Using Housing Vouchers Lake City Inglewood High-Opportunity Area Northeast Seattle Magnolia Central District Control Bellevue CMTO Treatment West Seattle Cougar Mountain Issaquah Newport Rainier Valley Burien Tukwila East Hill Des Moines Kent Lea Hill, Auburn
80 65.9% 60.5% 60 46.2% to High Opportunity Areas 40 Percent of Households Who Moved Diff. = 37.0 (10.8) Diff. = 55.6 (10.2) Diff. = 33.9 23.5% (7.3) 20 12.3% 10.3% 0 Control Treatment Control Treatment Control Treatment Black Non-Hispanic White Non-Hispanic Other Race/Ethnicity Treatment Effects By Race and Ethnicity
Tradeoffs in Unit Characteristics • Are families making sacrifices on other dimensions to move to high-opportunity areas?
1500 1419.9 1278.8 1000 500 0 Control Treatment Tradeoffs in Neighborhood and Unit Quality Treatment Effects on Distance Moved and Unit Size Unit Size Distance Moved Square Footage of Unit Difference: 141.1 sq. ft. SE: (110.1)
Satisfaction with New Neighborhoods Based on Surveys Six Months Post-Move Satisfaction with New Neighborhood Certainty about Wanting to Stay in New Neighborhood
Economic residential segregation in the United States appears to be partially driven by barriers in the housing search process Services to reduce barriers can increase moves to opportunity and thereby increase upward mobility substantially for low-income children Program cost is about $2,600 per family issued a voucher, or $4,700 per opportunity move CMTO is predicted to increase the lifetime household income of each child who moves at age 1 by $210,000 (10.4%) Also predicted to increase college attendance rates, reduce teen birth rates, and reduce incarceration rates significantly Conclusions
Seattle and King County Housing Authorities Andria Lazaga, Sarah Oppenheimer, Jenny Le, Jodi Speer MDRC James Riccio, Nandita Verma, Jonathan Bigelow, Gilda Azurdia J-PAL North America Jacob Binder, Graham Simpson, Kristen Watkins Opportunity Insights Federico Gonzalez Rodriguez, Jamie Gracie, Martin Koenen, Sarah Merchant, Max Pienkny, Peter Ruhm, James Stratton, Kai Matheson Johns Hopkins Fieldwork Team Paige Ackman, Christina Ambrosino, Divya Baron, Joseph Boselovic, Erin Carll, Devin Collins, Hannah Curtis, Christine Jang, Akanksha Jayathi, Nicole Kovski, Melanie Nadon, Kiara Nerenberg, Daphne Moraga, Bronte Nevins, Simon Robbennolt, Brianna So, Maria Vignau-Loria, Allison Young, MEF Associates This research was funded by the Bill & Melinda Gates Foundation, Chan-Zuckerberg Initiative, Surgo Foundation, the William T. Grant Foundation, and Harvard University From Jasmine, 7 years old, whose family moved to a high-opportunity area in Seattle
Key Elements in the CMTO Intervention CUSTOMIZED SEARCH ASSISTANCE • High-opportunity area education to increase families’ knowledge about high-opportunity areas. • Rental application coaching to increase families’ competitiveness for rental units by addressing credit history and preparing a narrative. • Housing locator services to help families identify suitable units in high-opportunity areas. INCREASED LANDLORD ENGAGEMENT • Cultivate relationships with landlords in designated high-opportunity areas to create housing opportunities for CMTO families. • Expedite lease-up processes by completing PHA required documents and conducting housing inspections more quickly. • Insurance fund to mitigate risks of property damage. SHORT-TERM FINANCIAL ASSISTANCE • Grants to defray move-in expenses, such as application fees and security deposits (on average $1,100).
Next Steps • Completion of CMTO Seattle-King County Phase I analysis with full sample of 421 with at least 6 months to lease-up and analysis of persistence in new neighborhoods • CMTO Phase 2 ongoing in Seattle-King County – does a CMTO “lite” version work and role of financial incentives alone • Going forward, we plan to partner with other cities to expand CMTO nationally • Aim to increase cost-effectiveness of program and better understand mechanisms • Of course, not all families can move to opportunity also studying which place-based investments have the biggest impacts on upward mobility in low-opportunity areas
Phase 2 Design: Three Treatment Arms PHASE 1 Apr. 2018 to Feb. 2019* PHASE 2 July 2019 to June 2020* 1. Comprehensive Support $ Retain phase 1 program Comprehensive Support Navigator Services Financial Assistance $ 2. Financial Incentives Only $ Provide only financial incentives Navigator Services Financial Assistance Financial Assistance 3. Cost-Optimized Comprehensive Support Reduce financial incentives and increase navigator caseloads $ Navigator Services Financial Assistance * Enrollment timeframes (interventions continue beyond enrollment)
Map of Origin Tracts for Voucher Recipients Lake City Inglewood High-Opportunity Area Northeast Seattle Magnolia Central District Control Bellevue CMTO Treatment West Seattle Cougar Mountain Issaquah Newport Burien Tukwila East Hill Des Moines Kent Lea Hill, Auburn
Distribution of Upward Mobility in Destination TractsFamilies Issued Vouchers by King County Housing Authority
Distribution of Upward Mobility in Destination TractsFamilies Issued Vouchers by Seattle Housing Authority
60.0% 60 Control 60 n = 45 Control Treatment Treatment 47.4% 40 n = 36 40 33.3% 35.0% Neighborhood Satisfaction Certainty About Wanting to Stay or Leave 28.6% 28.6% n = 7 n = 7 n = 6 n = 6 20 20.0% 20.0% 20 18.4% 17.3% 15.8% 15.0% n = 4 n = 4 12.0% n = 14 n = 13 11.8% 10.0% n = 12 n = 3 8.0% 6.6% n = 9 n = 9 4.8% 4.8% n = 2 2.7% n = 6 n = 5 0 0 n = 1 n = 1 n = 2 Very Sure Somewhat In the Middle Somewhat Very Sure Very Somewhat Neither Somewhat Very Wants to Sure Sure Wants to Dissatisfied Dissatisfied Satisfied nor Satisfied Satisfied Move Wants to Wants to Stay Unsatisfied Move Stay Difference in % Very Satisfied: 33.6pp Difference in % Very Sure Want to Stay: 29.5pp SE: (11.6) SE: (10.7) Post-Move Treatment Effects on Neighborhood Satisfaction Certainty about Wanting to Stay in New Neighborhood Satisfaction with New Neighborhood
Comparison Between MTO and CMTO Treatment Effects Upward Mobility in Destinations Conditional on Lease-up Lease-up Rates by Group Upward Mobility in Destinations Unconditional on Lease-up
5 Tier Reform in KCHA 50 48 In New Neighborhood (Forecast) Mean Household Income Rank (p=25) 46 44 42 Aug/Sep Oct/Nov Dec/Jan Feb/Mar Apr/May Jun/Jul Aug/Sep Oct/Nov 2015 2015 2015/16 2016 2016 2016 2016 2016 Date of Voucher Issuance Effect of 5-Tier Reform: 0.38 ranks (0.65) Effects of Voucher Payment Standard Changes on Moves to Neighborhoods with Higher Upward Mobility Effect of KCHA 5-Tier Reform 2.6 ranks KCHA SHA
48 47 46 45 In New Neighborhood (Forecast) Mean Household Income Rank (p=25) 44 43 42 Aug/Sep Oct/Nov Dec/Jan Feb/Mar/Apr May/Jun Jul/Aug Sep/Oct 2017 2017 2017/18 2018 2018 2018 2018 Date of Voucher Issuance Effect of Family Access Supplement: 1.20 ranks (0.64) Effects of Voucher Payment Standard Changes on Moves to Neighborhoods with Higher Upward Mobility Effect of SHA Family Access Supplement Supplement Introduced HHs w/ Kids CMTO Pilot HHs w/out Kids
Changes to King County Housing Authority Payment Standards in March 2016 Increase in Max Rent for 2BR Apt. > $400 $250 < $150
Opportunity Atlas vs. Other Measures of Economic Opportunity Upward Mobility (Opportunity Atlas) Kirwan Child Opportunity Index Shoreline Shoreline Inglewood Inglewood > 53 ($46k) > 0.68 SD Central District Central District Bellevue Bellevue West Seattle West Seattle Cougar Mountain Cougar Mountain 47 ($38k) 0.23 SD Tukwila Tukwila East Hill East Hill Kent Kent < 40 ($31k) < -0.44 SD Population-Weighted Correlation Across Tracts: 0.30
Creating Moves to Opportunity Experiment • Sample frame: families with at least one child below age 15 who were issued vouchers in either Seattle or King County between April 2018 to April 2019 • 421 eligible families in the experiment, split randomly into control (standard services) and treatment • Here we use data on 274 families issued vouchers up to December 31, 2018, followed through June 24, 2019 • 141 treatment families and 133 control families
Intervention Process Timeline Family Contacted Notified of selection from waitlist Unit Selected Family approved by landlord for unit Voucher Issued Lease Signed Intake Appointment Consent Randomization Baseline survey Lease Up Receive paperwork and financial assistance (e.g. assistance for deposit) Nonprofit Staff Meet with Families and Landlords Rental application coaching Opportunity area education Visiting locations Search assistance Landlord recruitment Linking families to units PHA Nonprofit Family Milestone
Outline Program Description and Experimental Design 1 Treatment Effect Estimates 2 Mechanisms 3 Conclusion 4