Download
1 / 4
40 likes | 137 Views
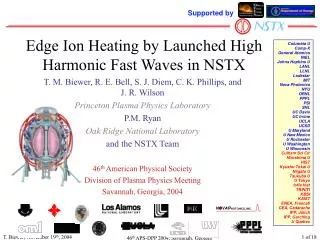
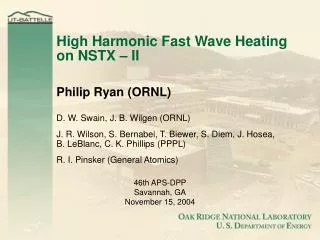
P. M. Ryan, D. W. Swain, M. D. Carter, E. F. Jaeger, R. A. Rasmussen, J. B. Wilgen, ORNL J. R. Wilson, J. C. Hosea, B. P. Leblanc, C. K. Phillips, A. L. Rosenberg, PPPL T. K. Mau, UC-San Diego , P. T. Bonoli, MIT , R. W. Harvey, CompX , and the NSTX Team.

E N D
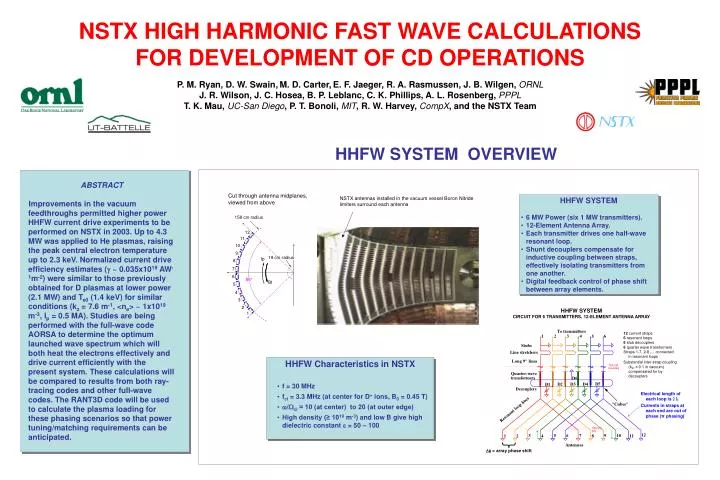
P. M. Ryan, D. W. Swain,M. D. Carter,E. F. Jaeger, R. A. Rasmussen, J. B. Wilgen, ORNL J. R. Wilson, J. C. Hosea, B. P. Leblanc, C. K. Phillips, A. L. Rosenberg, PPPL T. K. Mau, UC-San Diego, P. T. Bonoli, MIT, R. W. Harvey, CompX, and the NSTX Team NSTX antennas installed in the vacuum vessel Boron Nitride limiters surround each antenna NSTX HIGH HARMONIC FAST WAVE CALCULATIONS FOR DEVELOPMENT OF CD OPERATIONS HHFW SYSTEM OVERVIEW ABSTRACT Improvements in the vacuum feedthroughs permitted higher power HHFW current drive experiments to be performed on NSTX in 2003. Up to 4.3 MW was applied to He plasmas, raising the peak central electron temperature up to 2.3 keV. Normalized current drive efficiency estimates ( ~ 0.035x10¹⁹ AW-1m-2) were similar to those previously obtained for D plasmas at lower power (2.1 MW) and Te0 (1.4 keV) for similar conditions (kz = 7.6 m-1, <ne> ~ 1x10¹⁹ m-3, Ip = 0.5 MA). Studies are being performed with the full-wave code AORSA to determine the optimum launched wave spectrum which will both heat the electrons effectively and drive current efficiently with the present system. These calculations will be compared to results from both ray-tracing codes and other full-wave codes. The RANT3D code will be used to calculate the plasma loading for these phasing scenarios so that power tuning/matching requirements can be anticipated. Cut through antenna midplanes, viewed from above • HHFW SYSTEM • 6 MW Power (six 1 MW transmitters). • 12-Element Antenna Array. • Each transmitter drives one half-wave resonant loop. • Shunt decouplers compensate for inductive coupling between straps, effectively isolating transmitters from one another. • Digital feedback control of phase shift between array elements. HHFW SYSTEM CIRCUIT FOR 6 TRANSMITTERS, 12-ELEMENT ANTENNA ARRAY 12 current straps 6 resonant loops 6 stub decouplers 6 quarter wave transformers Straps 1-7, 2-8 ,... connected in resonant loops Substantial inter-strap coupling (k21 ≈ 0.1 in vacuum) compensated for by decouplers HHFW Characteristics in NSTX • f = 30 MHz • fci = 3.3 MHz (at center for D+ ions, B0 = 0.45 T) • w/Wci ≈ 10 (at center) to 20 (at outer edge) • High density (≥ 1019 m-3) and low B give high dielectric constant e = 50 – 100 Electrical length of each loop is 2 l Currents in straps at each end are out of phase (π phasing) Df = array phase shift
Co-CD Counter-CD Calculated electron power absorption profiles are coupled to Ehst-Karney adjoint solution for current drive efficiency to obtain current density profiles. B (near antennas) ASYMMETRIC PLASMA RESPONSE • HHFW WAVE SPECTRA • Fixed 180º phase shift between strap pairs 1-7, 2-8, … prevents spectral peak from being smoothly varied with Df. • Full 12-element array operation at Df = ±30º, ±90º gives single-peaked wave spectra. • At other relative phases, the system operates as two 6-element arrays, leading to double-peaked wave spectra. • Plasma response asymmetries are smaller at smaller wave numbers. • Plasma loading is smaller at smaller wave numbers. • Asymmetric response to symmetric array excitation • caused by large pitch angle of magnetic field • TORIC (Bonoli and Brambilla) • Full-wave ICRF field solver strictly valid in the ion FLR limit of (ki)2 << 1 • Run Order Reduction Algorithm (ORA)to obtain correct electric field polarization for the HHFW • Poloidal field neglected with ORA in TORIC - (B = 0). • AORSA (Jaeger) • Power deposition profiles from TORIC agree with profiles from the AORSA code, which has no limitations on kI and includes poloidal field effects. Pitch angle of the magnetic field at the antennas can be as large as 45º Power deposition profiles • CURRAY (Mau) • Ray-tracing code uses 11-110 rays to represent launched spectrum. • Power distribution : P(q) ~ cos2(koL) • Dispersion relation is hot electron and cold ion. • Damping is linear on Maxwellian species and includes hot plasma effects to all orders in ki, using k determined locally via an order reduction scheme. Calculated Spectra From RANT3D • Asymmetries between co-CD and counter-CD directions are more pronounced at higher wavenumbers. • Asymmetric plasma response means even symmetric phasings can give rise to directional wave spectra. kz power spectrum from GLOSI/RANT3D calculations TORIC and AORSA give similar power absorption profiles. TORIC sees significant reduction in JFW due to absorption by trapped electrons. Driven Current Density Profiles Strap # Strap # • Power absorption and current density profiles from CURRAY are peaked on axis for both co- and counter-CD cases • Nearly all power (96-100%) is absorbed on the electrons. Asymmetry in plasma response causes observed loading imbalance between co-CD and counter-CD phasing LOADING WITH Df = -p/2 PHASING IS 2X THE LOADING WITH +p/2 Measured load resistance Rload* for co-, counter-, and 00pp00 phasing agrees with calculations 12x12 impedance matrix from RANT3D (Im part, diag. term suppressed) shows asymmetry SUMMARY OF CURRENT DRIVE CALCULATIONS FOR 7 m-1 Co-CD Cntr-CD Total DI ICD/P gFW (kA) (kA) (kA) (A/W) (A•m-2/W) 0D 110 70 180 0.056 0.034 TORIC 96 50 146 0.046 0.028 CURRAY 162 79 241 0.075 0.046 HHFW PHASED-ARRAY OPERATION HHFW CURRENT DRIVE MODELING REAL TIME FEEDBACK CONTROL OF ARRAY PHASE HAS BEEN IMPLEMENTED • Inter-source phase control • Set electronically via a computerized waveform generator • Feedback control of source phases to fix the phases of antenna currents • Can set for any inter-source phasing, and can vary with time during a shot • Pre-programmed phase(t) • Operated with constant Df, and changed Df by 45° during a shot (e.g, 90° to 45°) • Phase errors generally < 10º.
Te(0) and line-average ne Co-CD Counter-CD Co-CD (solid) Cntr-CD (dotted) Te(0) <ne> RF On Te(0) neL RF ON (counter-CD) RF ON (co-CD) 0.22 V 0.22 V HHFW CURRENT DRIVE - EFFECT ON LOOP VOLTAGE Co-CD and counter-CD experiments were run with array phasings of Df = ± p/2 (k|| ~ ± 7.6 m-1) 107899: Co-CD, PHHFW = 2.1MW, solid lines 108907: Counter-CD, PHHFW = 1.2 MW, dotted lines HELIUM OPERATION (2003) DEUTERIUM OPERATION (2002) Repair and modification of the vacuum feedthroughs permitted power to be increased to 4.3 MW for the 2003 current drive experiments in He. Current drive efficiencies, based on decrease in loop voltage, are similar to those obtained at lower power in D plasmas in 2002. The RF power levels and gas feed were adjusted to similar electron temperature and density profiles for co- and counter-CD phasings. Te profiles at 0.31 and 0.39 s ne profiles at 0.31 and 0.39 s • Measurement of the current density profile awaits the installation of the MSE diagnostic (2003). In the meantime, ICD can be estimated from the difference in loop voltage between co/cntr-CD phasings for similar plasma conditions. • Assumptions: • Steady-state conditions (t > L/R) • Plasma ohmic resistance (RP) and pressure profiles (IBS) are independent of array phasing. • Driven current is proportional to the RF power (Ico/Pco = Icntr/Pcntr) and inversely proportional to the density. • Then the relation IP = (V-0.5*IP*dLi/dt)/RP + IBS + ICD (where the loop voltage is both driving the ohmic current and changing the magnetic stored energy) can be used to estimate the driven current. • DICD ~ 180 kA (110 kA co, 70 kA counter) • ICD/PRF = 0.05 A/W • gFW = ICD<ne>R/PRF = 0.034 x 10¹⁹ A • m-2/W Normalized Internal Inductance • DI = 208 kA (123 kA co, • 85 kA cntr) • ICD/PRF = 0.03 A/W • gFW = 0.03 x 10¹⁹ A•m-2/W • He operation • Df = ± p/2 (k|| = ±7.6 m-1) • Ip = 500 kA, B0 = 0.45 T DVLOOP, Internal Inductance AORSA predicts 183 to 256 kA with 4.3 MW for the co-CD case Loop Voltage The changing internal inductance needs to be taken into account when comparing the loop voltage difference. 0.27 V THE VOLTAGE DIFFERENCE BETWEEN CO-CD AND COUNTER-CD PHASINGS IS INDICATIVE OF HHFW DRIVEN CURRENT, BUT THE CURRENT DENSITY PROFILE MEASUREMENTS FROM THE MSE DIAGNOSTIC ARE NEEDED TO BE CERTAIN.
Driven current profiles as a function of density for Te(0) = 2 keV kz = 7.6 m-1 kz = 3 m-1 Match for -90º Match for -60º Reflection Coefficient Reflection Coefficient Driven current profiles as a function of electron temperature for ne(0) = 2e19 m-3 kz = 7.6 m-1 kz = 3 m-1 Match for -45º Match for -30º Reflection Coefficient Reflection Coefficient Density scan at constant temperature (Te(0) = 2 keV) Temperature scan at constant density (ne(0) = 2e19 m-3) CALCULATIONS FOR OPERATIONAL DEVELOPMENT OF CD SCENARIOS Full-wave calculations (AORSA) predict higher current drive efficiencies efficiencies for kz = 3 m-1 (Df = -30º) for central electron temperatures as low as 1 keV. DYNAMIC PHASE SHIFTING DURING PULSE • For Te(0) < 1 keV, the electron heating efficiency is higher for larger kz. • Heat at high kz and switch to low kz during the pulse for more efficient CD. • Need to maintain a match (reflection coefficient r < 0.3) during phase shifting. • The plasma impedance code GLOSI and the antenna analysis code RANT3D were used to calculate the loading as a function of phase shift for a typical plasma case. • Average loading seen by each of the six transmitters is 13.5 W at -90º, 15.9 W at -60º, and 14.7 W at -30º. • Loading should be high enough to couple full power to the plasma without exceeding antenna voltage limits. EXAMPLES OF DYNAMIC PHASE SHIFT FOR VARIOUS MATCH CONDITIONS EXP PTS EXP PTS • Difficult to maintain r < 0.3 as array phase shift is changed from -90º to -30º. • Feedback control on antenna voltage rather than transmitter power will be implemented during the next run period. • May be used in conjunction with plasma position control feedback to maintain match.