Download

1 / 17
170 likes | 309 Views
Bacterial concentrations in bull creek Austin, Texas. Patrick Sejkora. Overview. Overview Spatial Variations Seasonal Variations Further Work. Bull Creek. Spring fed Drains into Town Lake 32 mi 2 watershed Bordered by parks. Source: LCRA 2007. Bacteria in Bull Creek.

E N D
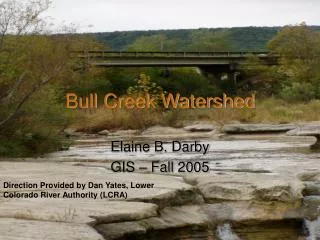
Bacterial concentrations in bull creekAustin, Texas Patrick Sejkora
Overview • Overview • Spatial Variations • Seasonal Variations • Further Work
Bull Creek • Spring fed • Drains into Town Lake • 32 mi2 watershed • Bordered by parks Source: LCRA 2007
Bacteria in Bull Creek • Evaluate presence of harmful waterborne pathogens • Bacterial water quality is assessed by indicator bacteria • Can indicate fecal contamination • Standards for recreation are set by TCEQ Source: TCEQ 2007
Sources of Bacteria Contamination Swallows Roosting on Bridges (spring and summer) • Septic Tanks • Storm Water Runoff Pets Wildlife
Statistical Tests • Select focus sites • Test spatial homogeneity of indicator bacteria concentrations • Examine seasonal homogeneity of bacteria concentrations • Test for correlation between bacteria concentration and flow/precipitation
Sources of Information • Biological Information Provided by City of Austin • Flow data accessed via HydroExcel • Precipitation data from LCRA’s Hydromet
Spatial E. Coli concentrations • Examine homogeneity of E. coli concentrations between sites • t-test
Spatial E. Coli concentrations n: 25 Mean: 44 Median: 27 Standard Dev: 4995% Confidence: 20 n: 45 Mean: 69 Median: 34 Standard dev: 44 95% Confidence: 21 n: 57 Mean: 363 Median: 218 Standard Dev: 454 95% confidence: 121 • Identify E. coli sources • Descriptive Statistics • t-test • Homogeneous between St. Edwards Park and Loop 360 (p=0.11) • Bull Creek District Park nonhomogeneous with Loop 360 and St. Edwards Park (p=3.0x10⁻⁶; p= 1.1x10⁻⁶) • t-test suggests dogs at Bull Creek District Park could be a possible source of E. coli
Weekend Hypothesis • If dogs are source, E. coli concentrations should be statistically higher on weekends • Observations • Mean E. coli concentration higher on weekends • Nonhomogeneous • Dogs appear to be cause of elevated E. coli at District Park p = 0.015
Seasonal Variations at Sites • Summer is April-October, winter is November-March • Observations • Average E. coli is higher in summer than in winter • Hypothesis • Could swallows be contributing to greater E. coli concentrations in Summer?
Seasonal E. Coli Concentrations t-test Winter n: 13 Summer n: 11 p = 0.04 • Observations • Seasonal E. coli concentrations are: • Statistically homogeneous at Bull Creek District Park • Not homogeneous at Loop 360 or St. Edwards Park Winter n: 24 Summer n: 13 p = 0.002 Winter n: 34 Summer n: 23 p = 0.20
Seasonal E. Coli Concentrations t-test Summer St. Edward mean: 62.6 Loop 360 mean: 886.6 p = 0.15 • Are seasonal E. coli concentrations homogeneous between two sites? • Concentrations homogenous between seasons • Swallows cannot be conclusively linked to increased E. coli concentrations between St. Edwards and Loop 360 Winter St. Edward mean: 24.3 Loop 360 mean: 49.0 p = 0.07
E. coli concentrations and Flow • Performed on Bull Creek District Park • Homogenous yearly data • Bacteria source affected by stormwater runoff • Conclusions • No real trend
E. Coli concentrations vs. Precipitation • Precipitation may be better metric • Causes bacteria from dog doo to wash into river • Observations • Better, but still not great • Remove dry events • Much better!
Further Work • Nonparametric methods of comparing E. coli concentrations over space and time • Investigate correlation between concentrations of different indicator organisms (Fecal Coliform, Fecal Streptococci)
Questions? “People can come up with statistics to prove anything. Forty percent of all people know that!” -Homer Simpson