Download

1 / 58
620 likes | 810 Views
Project Portfolio Management and Enterprise Project management. Discuss What Dekker, Ltd. Does Project Portfolio Management Earned Value Analysis Enterprise Project Management. Business Influences. Globalization Labor Base Drive To Produce Products And Services Cost Effectively

E N D
Project Portfolio Management and Enterprise Project management Discuss What Dekker, Ltd. Does Project Portfolio Management Earned Value Analysis Enterprise Project Management
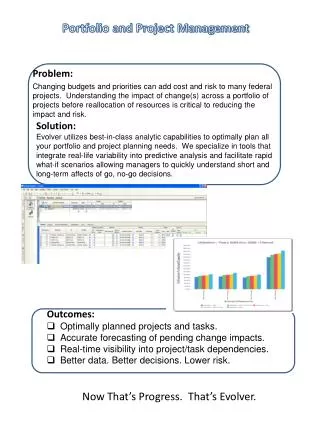
Business Influences • Globalization • Labor Base • Drive To Produce Products And Services Cost Effectively • Based On International Regions • Market Segmentation • Regions Unifying Market Sectors • Global Distribution Of Wealth • Competition • Corporate Management Influences • Sarbanes-Oxley • Government Performance Results Act (GPRA) • Competition For Revenue At An All Time High • Commercial • Government © 2004 Dekker, Ltd.
Organizations Becoming Projectized • General Tendency For Organizations To Become Projectized (Shermerhorn Et Al, 2003, p. 200-279) • Services: Provided to Customers • Products: Provided to Customers • Capitalized Capabilities: Service or Product Sponsored By An Organization To Gain Advantage • Project Teaming Commonplace Internal And External Organizations Efforts (Integrated Product Teams) • Monitoring Success Paramount • Problems Managing Project Portfolios • Too Many Projects (By 2-3 Times The Amount) • Wrong Projects (Return On Investment Ill Defined) • Projects Not Linked to Strategic Goals • Unbalanced Project Mix for Organizations • Reason for Problems: All Too Often ROI Is Not Understood Or Not Defined! © 2004 Dekker, Ltd.
Balanced Project Mix Project Prioritization Becomes Fundamental To Survival Project Each Sphere Of Influence Has A Project Demand… Finite Corporate Resources Available Those Projects That Return The Most Should Be Sponsored Project Project A Question Of What To Do… © 2004 Dekker, Ltd.
The Executive Mindset © 2004 Dekker, Ltd.
PPM Order of Insight Product/Service Goals And Objectives Below Estimates Over Utilization Of Strategic Labor Resources (Over Time)… Always Trying To Catch Up…. Labor Hours Collected Often… Schedule Slips and Missed Milestones…. Costs Can Take Up To 45-60 Days To Catch Up With Effort…. © 2004 Dekker, Ltd.
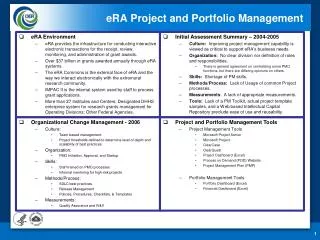
Definitions • Project Portfolio Management (PPM): The Systemic Ability Of An Organization To Monitor Projects Through Their Throughput Capacity, Investment Requirements, Operating Expenses, And Their Revenue Contribution In Satisfying Organizational Goals And Objectives • Enterprise Project Management (EPM): How An Organization Collects Data, Processes Information And Provides Stakeholder Views On Scheduling, Resourcing, Costing, Financial Performance And Technical Accomplishment Parameters; Data Elements Can Be Rolled Up To Reflect The Enterprise Or Sub-organizational Summaries On: • Resource Utilization • Cost Efficiency • Financial Performance • Organizational Goal Affiliation • Satisfaction Of Success Parameters (Kendall & Rollins, 2003, pp. 3-145) © 2004 Dekker, Ltd.
The Different Software Tools TRAKKER EPM Engine iPursuit Oversight Management Surveillance/Executive Information INTERNAL REPORTING SYSTEMS • Traditional Accounting • General Ledger • A/R • A/P • Payroll • Time Collection • Inventory • Profit/Loss for Organization • Balance Sheet Reporting • Tax Reporting • Enterprise Resource Planning • Does Traditional Accounting • Provides MRP II Capability • Provides Human Resource Planning • Job Cost Enhanced Through MRP and Human Resource • Sales System • Distribution System • Enterprise Project Management • Links Job Cost Charge Numbers to Operational Process/Activity Ledger • Tracks Schedule (CPM) Accomplishment and Risk by Any Unit • Tracks Resources in Any Unit of Measure • Tracks Direct & Indirect Rates • Can Determine and Use Burden Rates From Accounting Inputs for Forward Planning • Revenue by Project • Earned Value System • Links Activity Ledger to Negotiated WBS • Provides Earned Value Status Techniques • Links OBS to WBS • Draws Actuals From Accounting • Provides Estimated Actuals to Take Progress • Uses Escalatable Burden Rates • Provides EVM Reporting Capability • Rolled Up Reporting • Analysis Tools • Project Portfolio Management Views • Schedule Portfolio • Resource Portfolio • Cost Portfolio • Financial Portfolio • Output Performance Portfolio • Provides Analysis • Should Handle Full EIS Analysis • Performance Systems Were Developed Under A “Stove Piped” Environment • PPM Includes An EPM Engine To Run An Internal Performance Based System Integrated To Accounting • Knowing The Different Kinds Of Systems And Where They Fit © 2004 Dekker, Ltd.
PPM Data Reduction Process © 2004 Dekker, Ltd.
Implementing PPM – Project Management Office (PMO) © 2004 Dekker, Ltd.
PMO - Strategic Project Planning: Right Components • Throughput: (T) The Value Of Products/Service Rendered To Clients Minus All Costs Of Goods Sold To Include Labor And Non-labor Items. • Investment: (I) All Investments In Inventory At Any Level That Will Be Written Over One Period Of Performance (Fiscal Year). • Operating Expense: (OE) All Monies Spent To Turn Investment Into Throughput. • These Components Are Measured On Each Project And Are Used For Prioritization As Each Project Impacts Any Combination Of T, I, And OE • Increase Throughput • Reduce Investment • Reduce Operating Expenses • (Revenue Driven) Positive Impact © 2004 Dekker, Ltd.
Project Portfolio Management Project Prioritization Schedule Portfolio Resource Portfolio Asset Portfolio Financial Portfolio
Project Prioritization Risk versus Added Value Based on Funding or Revenue Profile Project 6 And Project 4 Could Be Competing For Resources With No Yield © 2004 Dekker, Ltd.
Sample Project Priority Format Continually Graded – Usually By Quarter… Cost Reduction Not Weighted High… Anything Mandated Is Typically Weighted Low Highest Priority is What Will Make Money Market Share Means Opportunity On Investment Projects That Score Greater Than 1 Are Worth Considering; Score Is Priority… Projects That Provide Greater Capacity To Improve Organization (Kendall & Rollins, 2003, pp. 155-339) © 2004 Dekker, Ltd.
Government Sample Project Priority Will Generate More Funding Opportunity. By How Much And When… Get More Sources Of Funding And Own Sponsors © 2004 Dekker, Ltd.
Project Priority - NPV NPV: A Sophisticated Capital Budgeting Technique Which Is Found By Subtracting The Initial Investment From The Present Value Of Its Cash Inflows At A Rate Equal To The Firms Cost Of Capital. Estimate At Complete In Terms Of Expenses And Revenue. General Project Information And Who Is Responsible General Scheduling Information For Entire Project; Target Date Is When The Project Goes Live (Kendall & Rollins, 2003, pp. 167-171) © 2004 Dekker, Ltd.
What is NPV? When NPV ≥ $0, Accept Project When NPV < $0. Reject Project “t” Can Be Any Time Increment (FY) Check Out MS Excel NPV Formula Where: CF Is Cash Flow Of Income II Is The Initial Investment 1+k Is The Discount Percent Rate NPV Is Most Common Technique Of Capital Project Valuation (Gitman Et Al, 2002, p. 622) © 2004 Dekker, Ltd.
Project Priority - NPV Discount Rate Is 15%, Which Typically Comes From 3 Times The Rate A Bank Would Give On Savings… Value 1 Is Negative, It Represents The EAC; Values 2 Through 4 Are The 3 Year Revenue Profile. Formula Result Is The NPV. A Value Of Zero Or Greater Would Indicate That You Should Accept The Project; Otherwise, You Should Reject The Project.. © 2004 Dekker, Ltd.
Project Prioritization - IRR • Internal Rate Of Return (IRR): “Sophisticated Capital Budgeting Technique; The Discount Rate That Equates Present Value Of Cash Inflows With Initial Investment Associated With A Project, Thereby Causing NPV = 0” (Gitman Et Al, 2002, P. 622-623). • IRR ≥ Cost Of Capital – Accept Project • IRR < Cost Of Capital – Reject Project Just Know That This Exists…. (Gitman Et Al, 2002, p. 622-645) © 2004 Dekker, Ltd.
Project Priority – On Goals When Ratings Get Nebulous The SLT Must Come Up With Practical Parameters To Measure Success… Goals Should Have A Unit Of Measure And Be Able To Be Tracked Objectively; Each Goal Has A Due Date And A Status Date © 2004 Dekker, Ltd.
Data Elements to Consider • Project Code: Short Name With Smart Coding Structure • Project Title: A Discrete Name For The Project • Project Manager: The Person, Or People, Responsible For The Project And Its Outcomes • Initiative Association: Which Senior Leadership Team Initiative The Project Is Supporting • Cash Flow: Investment Versus Revenue By Week, Month, Quarter, Year • Forced Rating: Rating Given By Governance Board; Board Can Change During Performance Time Cycles • Predecessor/Successor Projects: A Way Of Establishing The Order In Which A Project Is Executed • High Level Project Goal List: Key Accomplishment Goals That Are Measured In Terms Of Outcomes; Include Quantity, Quantity Accomplished, Date Due, Date Done • Net Present Value: (NPV) Use Especially For Capitalized Projects Sponsored Internally © 2004 Dekker, Ltd.
Schedule Portfolio Data Elements for Scheduling Enterprise Scheduling Basis of Resource Utilization
Single Views of A Project Duration Complete Remaining Duration Project Slip Actual Duration • The Slip Represented In The Percent Complete Line Should Be Proportional To The Slip On The Activity • The Length Of The Percent Complete Is Representative Of The Time Completed Of The Activity • The Days From Time Now To The End Of The Activity Represent Remaining Duration (Dekker, 2003) © 2004 Dekker, Ltd.
Quick Anatomy Of An Activity Remaining Duration Time Now Actual Duration Original Activity Duration Actual Start Actual Finish Float Early Start Early Finish Late Finish Original Activity Duration Early Start Late Start Late Finish Can Use Baseline And LRE Information To Make Projections… (Dekker, 2003) © 2004 Dekker, Ltd.
Elapsed Time Index • Elapsed Time Index (ETi): Measures The Ratio Between Original Duration Versus Actual Duration • = 1 - Indicates Project Should Finish On Time • < 1 - Unfavorable • > 1 - Possibly Favorable • How to Derive • MIN(ESDATE) • MAX(EFDATE) • Compare Original Baseline to Statused Project • Show Slips • ETi – Quick Schedule Risk (Dekker 2003) © 2004 Dekker, Ltd.
Problems with Summary Gantt Charts/CPM Charts • Summary Schedules Can Be Misleading • There Is No Parameter Helping Managers Understand The Dynamics Of The Project At The Detailed Level • Crashing Schedules: A Schedule Where Lower Level Activities Are Being Statused Out Of Logical Sequence To Maintain Project End Dates • There Are Methods To Help Determine The Underlying Dynamics Of Schedules • Shadowing • Statistics (ANOVA) © 2004 Dekker, Ltd.
Shadowing Analysis • Counts Are Informative • Show Added Scope • Points Out Status Of Progress • Accumulated Over All Activities • Timephased Analysis Helps Understand Lower Dynamics Of Schedule • Can Be Used On Very Large Schedules Summarized Into A Few Lines By: • Activity Type • WBS Leg • Provides The Basis Of Some Scheduling Statistics © 2004 Dekker, Ltd.
Activity Shadowing • Based Upon Comparison Between Baseline And Target Schedules • Looks At Activity Profile In Terms Of Incremental Count • Adds Up Activities Per Period • Starts • In Progress • Finishes • Can Be Summarized • Activities • Milestones • Summary Tasks • Relative Parallelity • Look At Baseline • Compare LRE • Variations Can Occur… Middle Loaded 1 3 3 1 (Dekker, 2003) Time © 2004 Dekker, Ltd.
Variations Of Incremental Counts Middle Loaded Rear Loaded Front Loaded Time (Dekker, 2003) © 2004 Dekker, Ltd.
Middle Loaded B A Activity Shadowing Time A – B = 0 A – B > 0 On Schedule Ahead of Schedule (Dekker, 2003) © 2004 Dekker, Ltd.
Activity Shadowing Middle Loaded Time A B A – B = 0 A – B < 0 On Schedule Behind Schedule (Dekker, 2003) © 2004 Dekker, Ltd.
Activity Shadowing No Change In Total Count Between Baseline And LRE Activity Sway Is To The Left Indicating Ahead Of Schedule Condition Note Negative Trend is Forward… (Dekker, 2003) © 2004 Dekker, Ltd.
Activity Shadowing No Change In Total Count Between Baseline And LRE Activities Pushed To Right Of Schedule, Or Behind Condition Variance Trails To The End Of Schedule… (Dekker, 2003) © 2004 Dekker, Ltd.
Activity Shadowing More Activities In LRE Than In Baseline LRE Goes Over The Area For Baseline Variance In Count Shows Additions To Critical Activities (Dekker, 2003) © 2004 Dekker, Ltd.
Activity Shadowing Less Activities In LRE Than In Baseline LRE Shows Missing Activities LRE Variance To Baseline Would Also Show Discrepancy… (Dekker, 2003) © 2004 Dekker, Ltd.
Cumulative Milestone Metrics Variance © 2004 Dekker, Ltd.
Cum Activity Start and Finish Count Displays The Number Of Activities Planned To Finish In Each Period Shows The Number Of Activities Planned To Start In Each Period Includes Each Period Of The Project The Lines Represent Cumulative Values © 2004 Dekker, Ltd.
Cum Activity Start and Finish Count Shows That Activities Have Been Added To The Project Additional Activities Are Slipping Into Later Periods © 2004 Dekker, Ltd.
Looking At Events • Events In A Schedule Represent A Point In Time • Points In Time Are • Milestones • Interim Milestones • Starts • Finishes • Counts On All Events Are Useful And Can Be Used For • Cumulative Timephased Counts • Timephased Shadowing Counts © 2004 Dekker, Ltd.
Integration With Cost Performance Project Activity Duration Float Early Dates Late Dates Count Budget Budget Time • Lines Represent Activity Count Between: • Early Start And Finish Dates • Late Start And Finish Dates • Budget Represents Cost Profile • Bar Chart Depicts The Entire Project And Average Durations Coupled With Float • Analyze How Budgets Were Loaded For This Project • What Is The Implication During Status? (Dekker, 2003) © 2004 Dekker, Ltd.
Statistical Algorithms To Compare Durations • Weekly, Bi-weekly Or Monthly - Large Volumes Of Schedule Data Can Be Collected From Various Sources • Schedules Are Implemented From Various Levels Into The Master Schedule • Schedule Data Composed Of ORGDUR, LREDUR And ACTDUR Each Measured In Work Days • Consider That In An Ideal World All Three Durations Could Be Considered As Populations And Should Be Equal • The Three (3) Durations Can Be Compared Via ANOVA, A Statistical Analysis Of Variance (ANOVA) • Means For Each Durations Can Be Used For Another Set Of SPIs • The Mean Value For The ORGDUR In The Baseline Can Be Used To Measure Against The Means Of LREDUR And ACTDUR • SPi = ORGDUR/LREDUR Or ORGDUR/ACTDUR • Risk Duration Can Be ORGDUR/SPI For Overall Program © 2004 Dekker, Ltd.
Statistical Conclusions • In Our Example, Both ANOVA Tests Cause Us To Fail To Reject The Null Hypothesis; The Durations Are Still Within Probability Tolerance • The Means from the LREDUR, ACTDUR and ORGDUR are the same based upon ANOVA • There Is A Difference Between The ACTDUR And Both The LREDUR And ORGDUR • SPi Based Upon Durations Appears To Provide Early Insight Into Schedule Efficiency • Comparisons Are Provided Next © 2004 Dekker, Ltd.
Sample Schedule Portfolio Format © 2004 Dekker, Ltd.
Resource Portfolio Management The Purpose Of The Resource Portfolio The Role Of The PMO In A Resource Portfolio Knowing What A Strategic Resource Is
The Resource Portfolio and the PMO • It Is Not The Role Of The PMO To: • Ensure All Timesheets Are Filed • Ensure That All Resources Are Used Efficiently • Plan At The Individual Level • The PMO Focuses On The Multi-project Environment • An Organization’s Precious Strategic Resources Provide Best Value To The Organization • Capacity Of The Organization Meets Demand Of Project Goals • Resources Are Not Wasted On Low Priority Projects © 2004 Dekker, Ltd.
Strategic Resources • Strategic Resource: A Resource That Is Used By Many Projects In Which There Is A Finite Capacity Limit • Can Be A Labor Pool • A Very Special Individual (Red Flags Everywhere) • A Small Group Of Individuals (Think Skill) • Can Be Equipment (Limited Capacity) • Critical Exhaustible Material • Special Buildings/Floor Space • By-name Planning Should Be Avoided • People Leave (Attrition) • Move On Within The Corporation • Cause Re-planning © 2004 Dekker, Ltd.
Example (Resource Pool) © 2004 Dekker, Ltd.
Timephased Example (Resource Pool) © 2004 Dekker, Ltd.
Example (Resource Pool) NPV Can Also Be Used To Determine Valuations For Assets… Cash flows Come From All Projects Using The Resource… © 2004 Dekker, Ltd.