Download
1 / 77
770 likes | 869 Views
DAY 4 Considerations for Interpretation Bias Participation Rate Reversed Time Order. EPI CHALLENGE Proposal Form Considerations for Interpretation Participation Rate.

E N D
DAY 4 Considerations for Interpretation Bias Participation Rate Reversed Time Order
EPI CHALLENGE Proposal Form Considerations for Interpretation Participation Rate 7b. Describe what the term “participation rate” means, and explain why it is important to know it. Use a formula or diagram if you wish. Explain how you will calculate the participation rate for your study. EPI Challenge Master Proposal Form Name of Team Member ________________
EPI CHALLENGE Proposal Form Considerations for Interpretation Representativeness 7c. Describe why representativeness is important in the interpretation of your study results. Develop an additional question for your survey that will help your team determine the representativeness of the group of students that participated in your study. EPI Challenge Master Proposal Form Name of Team Member ________________
EPI CHALLENGE Proposal Form Considerations for Interpretation Bias and Reversed Time Order 7d. Describe one form of bias that might influence the possible association between your exposure and outcome. 7e. Describe how reversed time order might affect your interpretation of study results. EPI Challenge Master Proposal Form Name of Team Member ________________
Big Epi Idea One possible explanation for finding an association is because the exposure causes the outcome. Because observational studies are complicated by factors not controlled by the investigator, other explanations also must be considered, including, confounding, bias, and reversed time order.
Big Epi Idea One possible explanation for finding an association is because the exposure causes the outcome. Because observational studies are complicated by factors not controlled by the investigator, other explanations also must be considered, including, confounding,bias, and reversed time order.
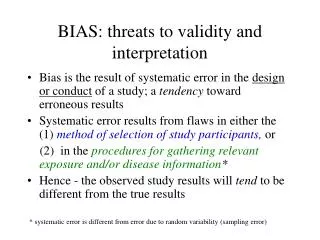
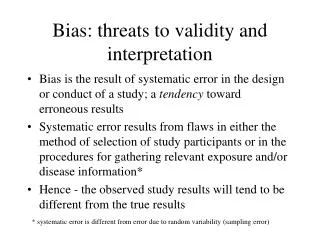
Bias Any systematic error in the design, conduct, or analysis of a study that results in a mistaken estimate of an exposure’s effect on the outcome
In a x-sectional study, what do we call the estimate of an exposure’s effect on the outcome? Bias Any systematic errorin the design, conduct, or analysis of a study that results in a mistaken estimate of an exposure’s effect on the outcome
Exposure No Exposure In a x-sectional study, what do we call the estimate of an exposure’s effect on the outcome? Bias No Outcome Outcome Prevalences Prevalence Ratio Outcome Total 60% 10 90 a b c d 10 90 20% Any systematic error in the design, conduct, or analysis of a study that results in a mistaken estimate of an exposure’s effect on the outcome
Exposure No Exposure Bias No Outcome Outcome Prevalences Prevalence Ratio Outcome Total 50% 10 90 a b 1 c d 10 90 50% Any systematic error in the design, conduct, or analysis of a study that results in a mistaken estimateof an exposure’s effect on the outcome
Exposure No Exposure Bias No Outcome Outcome Prevalences Prevalence Ratio Outcome Total 25% 10 90 a b .5 c d 10 90 50% Any systematic errorinthe design, conduct, or analysis of a study that results in a mistaken estimateof an exposure’s effect on the outcome
Exposure No Exposure Bias No Outcome Outcome Prevalences Prevalence Ratio Outcome Total 50% 10 90 a b 2 c d 10 90 25% Any systematic errorinthe design, conduct, or analysis of a study that results in a mistaken estimateof an exposure’s effect on the outcome
Information Bias A flaw in measuring exposure or outcome data that results in different quality of data between comparison groups
Information Bias A flaw in measuring exposure or outcome data that results in different quality of data between comparison groups
Alcohol No Alcohol Information Bias No Birth Defect Outcome Prevalences Prevalence Ratio Birth Defect Total 10 90 5% a b 1 c d 10 90 5% A flaw in measuring exposure or outcome data that results in different quality of data between comparison groups
Alcohol No Alcohol Information Bias No Birth Defect Outcome Prevalences Prevalence Ratio Birth Defect Total 10 90 5% a b 1 c d 10 90 5% A flaw in measuring exposure or outcome data that results in different quality of data between comparison groups
Sports Participation No Sports Participation Information Bias Outcome Prevalences Prevalence Ratio High GPA Low GPA Total 60% 10 90 a b 3 c d 10 90 20% A flaw in measuring exposure or outcome data that results in different quality of data between comparison groups
Hyper Texting No Hyper Texting Information Bias Outcome Prevalences Prevalence Ratio Low GPA High GPA Total 30% 10 90 a b 1 c d 10 90 30% A flaw in measuring exposure or outcome data that results in different quality of data between comparison groups
Information Bias A flaw in measuring exposure or outcome data that results in different quality of data between comparison groups Recall Bias Systematic error due to differences in the accuracy and completeness of the recall to memory of past experiences
Information Bias A flaw in measuring exposure or outcome data that results in different quality of data between comparison groups Recall Bias Systematic error due to differences in the accuracy and completeness of the recall to memory of past experiences
Exposure No Exposure Recall Bias No Outcome Outcome Prevalences Prevalence Ratio Outcome Total 30% 10 90 a b 1 c d 10 90 30% Systematic error due to differences in the accuracy and completeness of the recall to memory of past experiences
Stress No Stress Recall Bias No Birth Defect Outcome Prevalences Prevalence Ratio Birth Defect Total 8% 10 90 a b 4 c d 10 90 2% Systematic error due to differences in the accuracy and completeness of the recall to memory of past experiences
Selection Bias Error due to systematic differences in characteristics between those who take part in a study and those who do not
Exposure No Exposure Did Not Participate Selection Bias No Outcome Outcome Prevalences Prevalence Ratio Outcome Total 25% 10 90 a b 1 c d 10 90 25% Did Participate Error due to systematic differences in characteristics between those who take part in a study and those who do not
Marijuana No Marijuana Did Not Participate Selection Bias Outcome Prevalences Prevalence Ratio Low GPA High GPA Total 25% 10 90 a b 1 c d 10 90 25% Did Participate Error due to systematic differences in characteristics between those who take part in a study and those who do not
More Sleep Less Sleep Did Not Participate Selection Bias Less Physical Activity More Physical Activity Outcome Prevalences Prevalence Ratio Total 66.7% 10 90 a b 4.7 c d 10 90 14.3% Did Participate Error due to systematic differences in characteristics between those who take part in a study and those who do not
Big Epi Idea One possible explanation for finding an association is because the exposure causes the outcome. Because observational studies are complicated by factors not controlled by the investigator, other explanations also must be considered, including, confounding,bias, and reverse time order.
From Epi Textbooks Non-response is a particular problem affecting cross-sectional studies and can result in bias of the measures of outcome.
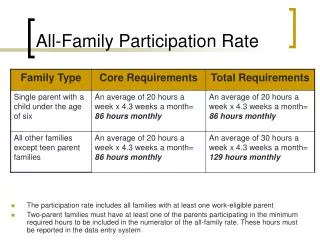
Participation Rate The number of completed survey instruments divided by the total number of persons who would have been surveyed if all participated. Usually expressed as a percentage.
Participation Rate Results The completed interview rate for adolescents was 48%.
Participation Rate What did the investigators need to do in order to calculate their participation rate? What do you want your response rate to be? Results The completed interview rate for adolescents was 48%.
Calculate Your Participation Rate EPIC Summer Session 2 Presentations June 26, 2015 What will you need to do in order to calculate your participation rate? XXXXXXXXXXXXXXXXXXXXXXXXXXXXXXXXXXXX XXXXXXXXXXXXXXXXXXXXXXXXXXX Xxxxxx, Xxxxxx, Xxxxxx, Xxxxxx, Xxxxxx Results The completed interview rate for adolescents was 48%. XXXXXXXXXXXXXXXXXXXXXXXXXXXXXXXXXXXXXXXXXXX
Representative Sample A representative sample resembles the population from which it was taken in some way.
From Epi Textbooks Non-response is a particular problem affecting cross-sectional studies and can result in bias of the measures of outcome.
From Epi Textbooks Non-response is a particular problem affecting cross-sectional studies and can result in bias of the measures of outcome. This is a particular problem when the characteristics of non-responders differ from responders.
Representativeness of Participants What could the investigators have done to get a sense of the representativeness of the participants in their investigation? Are the 48% who participated similar or dissimilar to those who were invited to participate? Results The completed interview rate for adolescents was 48%.
Representativeness of Participants Are the 48% who participated similar or dissimilar to those who were invited to participate? Results The grade levels of the adolescents invited to participatewere 25% freshmen, 25% sophomores, 25% juniors, and 25% seniors. The grade levels of the adolescents who did participatewere 25% freshmen, 25% sophomores, 25% juniors, and 25% seniors.
Representativeness of Participants Are the 48% who participated similar or dissimilar to those who were invited to participate? Results The grade levels of the adolescents invited to participatewere 25% freshmen, 25% sophomores, 25% juniors, and 25% seniors. The grade levels of the adolescents who did participatewere 40% freshmen, 30% sophomores, 20% juniors, and 10% seniors.
Representativeness of Participants EPIC Summer Session 1 Survey Wednesday, June 23, 2014 The answer to what question from our SS1 survey could be used to get a sense of the representativeness of the SS1 participants who completed the survey? Are the XX% who participated similar or dissimilar to those who were invited to participate? Results The distribution of the schools among possible SS1 survey participantswas 20% Cedar Cliff, 20% John Harris, 20% Lower Dauphin, 20% Middletown Area, and 20% Sci Tech . The distribution of the schools among the actual SS1 survey participants was 20% Cedar Cliff, 20% John Harris, 20% Lower Dauphin, 20% Middletown Area, and 20% Sci Tech .
Representativeness of Participants EPIC Summer Session 1 Survey Monday, June 23, 2014 Are the XX% who participated similar or dissimilar to those who were invited to participate? Results The distribution of the schools among possible SS1 survey participants was 20% Cedar Cliff, 20% John Harris, 20% Lower Dauphin, 20% Middletown Area, and 20% Sci Tech . The distribution of the schools among the actual SS1 survey participantswas ___% Cedar Cliff, ___% John Harris, ___% Lower Dauphin, ___% Middletown Area, and ___% Sci Tech .
Representativeness of Participants EPIC Summer Session 2 Presentations June 26, 2015 What question can you include in your survey so that you can get a sense of the representativeness of your participants? XXXXXXXXXXXXXXXXXXXXXXXXXXXXXXXXXXXX XXXXXXXXXXXXXXXXXXXXXXXXXXX Xxxxxx, Xxxxxx, Xxxxxx, Xxxxxx, Xxxxxx Results The completed interview rate for adolescents was 48%. XXXXXXXXXXXXXXXXXXXXXXXXXXXXXXXXXXXXXXXXXXX
From Epi Textbooks One possible explanation for finding an association is because the exposure causes the outcome. Because observational studies are complicated by factors not controlled by the investigator, other explanations also must be considered, including confounding, bias, and reversed time order.