Download
1 / 14
140 likes | 162 Views
Learn how to graph equations, create tables of values, and find equations from graphs. Understand the relationship between algebraic expressions and graphical representations. Practice plotting points, drawing lines, and determining equations from graphs.

E N D
Graphs of Straight Lines How to graph equations and find equations from graphs.
Tables of Values • A table of values is used to generate points. • These points can be plotted on the coordinate plane. • A straight line drawn through these points creates the graph of the equation.
Example Graph y = 2x – 5 3 -3 -1 1 5
Exercises Graph the following straight lines: • y = 3x – 4 • y = 2x + 1 • y = x – 5 • y = -3x +2 Look for a relationship between the graphs and their algebraic expressions!!!
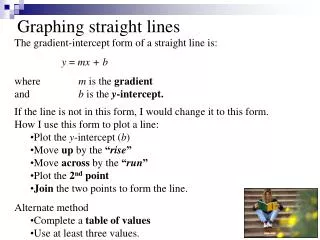
The Gradient-Intercept Form of a Straight Line When a linear function is written in the form y = mx + b the m is its gradient and the b is its y-intercept.
What’s the Equation? For the following graphs, determine their equation.
This powerpoint was kindly donated to www.worldofteaching.com http://www.worldofteaching.com Is home to well over a thousand powerpoints submitted by teachers. This a free site. Please visit and I hope it will help in your teaching