Download
1 / 4
40 likes | 50 Views
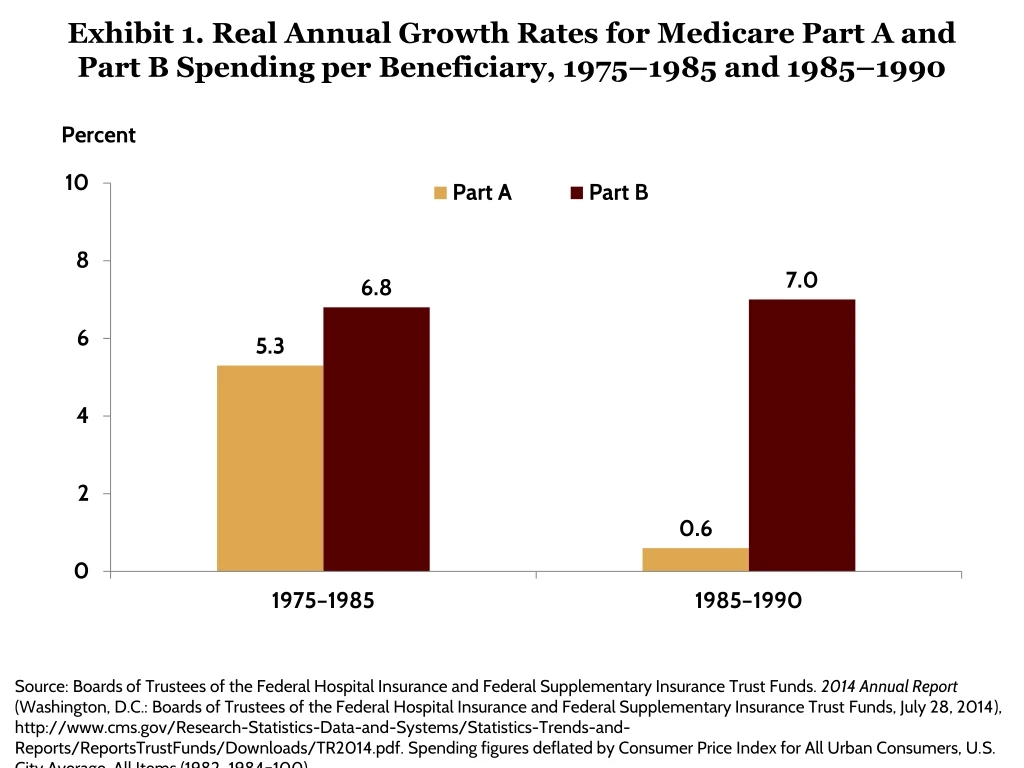
Exhibit 1. Real Annual Growth Rates for Medicare Part A and Part B Spending per Beneficiary, 1975–1985 and 1985–1990. Percent.

E N D
Exhibit 1. Real Annual Growth Rates for Medicare Part A andPart B Spending per Beneficiary, 1975–1985 and 1985–1990 Percent Source: Boards of Trustees of the Federal Hospital Insurance and Federal Supplementary Insurance Trust Funds. 2014 Annual Report(Washington, D.C.: Boards of Trustees of the Federal Hospital Insurance and Federal Supplementary Insurance Trust Funds, July 28, 2014), http://www.cms.gov/Research-Statistics-Data-and-Systems/Statistics-Trends-and-Reports/ReportsTrustFunds/Downloads/TR2014.pdf. Spending figures deflated by Consumer Price Index for All Urban Consumers, U.S. City Average, All Items (1982–1984=100).
Exhibit 2. Real Annual Growth Rate of Medicare Part B Spending per Beneficiary, Five-Year Intervals, 1975–2000 Percent Source: Boards of Trustees of the Federal Hospital Insurance and Federal Supplementary Insurance Trust Funds. 2014 Annual Report(Washington, D.C.: Boards of Trustees of the Federal Hospital Insurance and Federal Supplementary Insurance Trust Funds, July 28, 2014), http://www.cms.gov/Research-Statistics-Data-and-Systems/Statistics-Trends-and-Reports/ReportsTrustFunds/Downloads/TR2014.pdf. Spending figures deflated by Consumer Price Index for All Urban Consumers, U.S. City Average, All Items (1982–1984=100).
Exhibit 3. Percentage of Traditional Medicare Payment Tied to Quality or Value, and Goals for the Future Sources: Catalyst for Payment Reform, “First of Its Kind Scorecard on Medicare Payment Shows Widespread Payment Reform” (press release), May 5, 2015, http://www.catalyzepaymentreform.org/images/Press_Release_Scorecard_on_Medicare_Payment_Reform_final.pdf; and S. M. Burwell, “Setting Value-Based Payment Goals—HHS Efforts to Improve U.S. Health Care,” New England Journal of Medicine, March 5, 2015 372(10):897–99.
Exhibit 4. Medicare Shared Savings Program: Year 1 (2013) Performance of Participating ACOs 220 Medicare Shared Savings Program ACOs Source: M. Abrams, R. Nuzum, M. Zezza, J. Ryan, J. Kiszla, and S. Guterman, The Affordable Care Act’s Payment and Delivery System Reforms: A Progress Report at Five Years (New York: The Commonwealth Fund, May 2015).