Download
1 / 35
360 likes | 608 Views
Systems Integration, Cost Effectiveness Analysis, and Prioritization of Multimodal Transportation Projects. MS Thesis Proposal Presentation Shadi Wadie March 2, 2005. . Acknowledgements. Thesis Committee Professor Lambert Professor Farver Professor Scherer Michael Fontaine

E N D
Systems Integration, Cost Effectiveness Analysis, and Prioritization of Multimodal Transportation Projects MS Thesis Proposal Presentation Shadi Wadie March 2, 2005 .
Acknowledgements Thesis Committee • Professor Lambert • Professor Farver • Professor Scherer • Michael Fontaine • Matthew Grimes Other Assistance • Chad Tucker, VDOT • VTrans2025 Technical Committee
Agenda • Background • Research Goals • Proposed Methodology • Future Work
Background - Project • In 2002 the Virginia General Assembly passed a bill calling for the development of a statewide multimodal long-range transportation plan • Largely the result of inefficient spending and an estimated deficit in transportation funds of $108B by the year 2025 • Current project with VDOT • Analytical Support for the Statewide Long-Range Transportation Plan (VTrans2025) • Vision of the VTrans2025 effort to improve coordination among transportation modal agencies • Study and perform analyses on multimodal transportation networks in Virginia • Past analyses of multimodal investments • Some use performance based evaluation, yet none explore a comparison of single-mode vs. multimodal investment
Background - Research • Focusing on multimodal integration of project plans from the various modal agencies • Analysis methods are needed to demonstrate their advantages • Transportation agencies in Virginia need to work closer with one another • Needed to create a system that would capture the integration of various components between the state and local transportation levels • Particular emphasis placed on coordination and prioritization of these multimodal transportation projects without modal bias (Pedersen, 1999)
Background – Multimodal Investment Networks (MIN) • A Multimodal Investment Network (MIN) is a group of interdependent and interrelated transportation projects reflectingstatewide goals and objectives involving more than one mode of transportation • Purpose of multimodal (MIN) investments is to create a more efficient transportation system in Virginia by providing diverse transportation alternatives • List of MINs in Virginia
Who decides statewide goals and objectives? • The VTrans2025 Technical committee, using input from communities and transportation agencies across the state, accumulated a set of measures and objectives for MINs to be evaluated against • Six major performance criteria • Safety and Security • Preservation and Management of existing system(s) • Efficient Movement of People and Goods • Economic Vitality • (Environmental) Quality of Life • Program Delivery
Modal Agencies Incorporate MINs in Programming Background - MIN Integration MIN and Sponsors are Identified Sponsors Submit MIN Application Multimodal Policy Committee Prioritizes MINs for Implementation Technical Committee Scores and Ranks all Submitted MINs Process for MIN Implementation (VTrans2025, 2004)
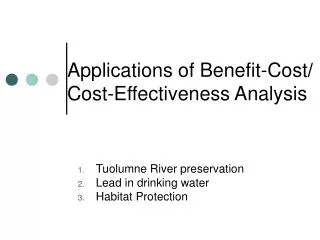
Research Goals – High Level • Help to develop multi-objective, performance-based evaluation method of multimodal transportation investments • Apply and test methodology to pre-defined MINs in Virginia - subject to a list of performance measures and objectives • Implement systems integration methodology to determine MIN capital cost – in addition to a breakdown of modal costs comprising it • Compare each MIN implementation with a single-mode (highway-intensive) alternative investment strategy (NCHRP, 2000) More details
Methodology – Performance Prioritization • MINs considered with respect to six major performance criteria • Within a given criterion are performance factors, which in turn retain performance measures for consideration • Each MIN receives a user score relative to each performance measure considered • +1 MIN is well-performing relative to the performance measure • 0 MIN has no effect relative to the performance measure • -1 MIN negatively performs relative to the performance measure • Six major performance criteria and each performance measure receive user-inputted weights to be applied in the analysis • ∑ Criteria weights = 100% • ∑ Performance measure weights (within a major criterion) = 100%
MIN Scoring Worksheet • Performance Criterion # 1 • Performance measure 1.2a • MIN user-score for performance measure 1.2a
Performance Measure Weighting • Six major performance criteria • Table of user-inputted weights for performance measures considered
MIN Scoring Algorithm Major Criteria X1 = Weight to major performance criterion #1 X2 = Weight to major performance criterion #2 Performance Measures within Major Performance Criterion #1 Y11A = Weight to performance measure 1.1a Y12A = Weight to performance measure 1.2a Y12B = Weight to performance measure 1.2b Performance Measures within Major Performance Criterion #2 Y21A = Weight to performance measure 2.1a Y21B = Weight to performance measure 2.1b Y22A = Weight to performance measure 2.2a Y22B = Weight to performance measure 2.2b Y22C = Weight to performance measure 2.2c Y22D = Weight to performance measure 2.2d US = User score (0, +1, or -1)
MIN Scoring Algorithm (cont) MIN score from major criterion # 1 = (X1* Y11A*US) + (X1* Y12A*US) + (X1* Y12B*US) MIN score from major criterion # 2 = (X2* Y21A*US) + (X2* Y21B*US) + (X2* Y22A*US) + (X2* Y22B*US)+ (X2* Y22C*US) + (X2* Y22D*US) MIN score from major criterion N = [(XN* YN1A*US) + (XN* YN1B*US) +…+ (XN* YN1Z*US)] + [(XN* YN2A*US) + (XN* YN2B*US) +…+ (XN* YN2Z*US)] where, Z = number of performance measures within Nth major performance criterion MIN Score = 100 * ∑ Weighted MIN scores across N major performance criteria
Sample MIN Results Weighted Scores within each policy … Rankings within each policy …
Sample MIN Scores (cont) • Graphical display of MIN scores received, including each’s average score
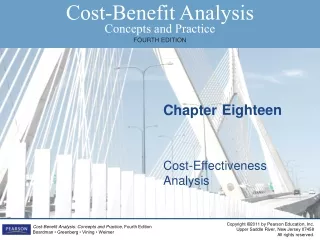
Methodology – MIN Cost Analysis • Performance-based evaluation lacked monetary consideration in analysis • Aimed to analyze MINs using a common metric ($) to all modes of transportation (NCHRP, 2000) • Goals of MIN cost analysis • MIN capital cost estimation • Equivalent single-mode investment • Highway-intensive implementation • Cost savings comparison of multimodal investment with single-mode option
MIN Capital Cost Estimation • Information about Virginia’s MINs and their transportation projects pre-defined by VTrans2025 • Research efforts focused on data (cost) collection from the various transportation agencies, state and modal-specific • VDOT provided twenty-year highway recommendations for each district in Virginia – in addition to an interstate recommendation sheet • Recommendation sheets retained a number of projects within the MINs • Publications/reports also obtained from VTrans2025 Technical Committee meetings and online resources • Multiple project costs are referenced from these data sources
MIN Capital Cost Estimation • Separated modes of transportation • List of transportation projects within this MIN • Note 6
MIN Capital Cost Estimation (cont) • All transportation projects within a given MIN have a note associated with them • Each note gives information about that transportation project • Mode of transportation • Route number (if roadway project) • District • Jurisdiction • Justification where the cost was obtained, and • Associated mileage (if roadway project)
MIN Capital Cost Estimation (cont) List of notes for each transportation project within the I-95 Passenger/Goods Movement MIN
Highway-Intensive Database • The research effort located a source of data (provided by Mr. Chad Tucker from VDOT) containing twenty-year highway-intensive transportation solutions for Virginia • Contained over 3,000 roadway improvements spanning all districts in the Commonwealth • Database: Needs Analysis • Characterized by two-mile segments assessed at a time throughout Virginia’s 60,000 mile system • Used for estimating how many lanes are needed based on future volume projections
Highway-Intensive Database (cont) • Each roadway improvement contained its • District • Jurisdiction • Route Number • Starting point and ending point • Improvement length (miles) • Improvement cost ($)
Method for Highway-Intensive Implementation • Provided with maps of Virginia containing defined area spanned by each MIN region (VTrans2025) • Compared MIN region with VDOT maps to partition area spanned by MIN • Used district maps from VDOT to find roadway improvements falling within defined MIN region • Twenty-year improvements grouped by district VDOT Map of Northern Virginia District
Highway-Intensive Implementation • List of all districts containing roadway improvements within the I-95 Passenger/Goods Movement MIN region • Total mileages of roadway improvements within the specified districts • Capital costs associated with roadway improvements within the specified district
Highway-Intensive Implementation • List of roadway improvements from needs database falling within the I-95 MIN region • Improvements grouped by district and corresponding jurisdiction • All route numbers listed, with a cumulative mileage and capital cost associated
MIN Cost Savings • Cost savings calculation shown, calculating difference in MIN implementation with highway-intensive alternative
Future Work - Tasks • Incorporating cost analysis with computer tool • Cost-Benefit Analysis • Potential application to larger systems
Legend: Accessibility Cost Development Economic Crashes Efficiency ADT Environment Mobility Safety Preservation System Computer Tool • Incorporate transportation project costs from MIN cost analysis into this interface • Allows for comparison of transportation project information (Crashes, ADT) relative to two primary motivations • Figure to the right represents transportation projects for a single mode Note: Funded projects are indicated by shaded icons.
Computer Tool (cont) • Each mode of transportation retains its own interface • Aim is to determine dominance relationships between transportation projects • Both within and across modes
Additional Tasks • Continuously searching for new ways to use available data • Cost-Benefit Analysis • Using performance metrics (system throughput, average travel time, etc) to quantify economic gains from multimodal implementations • Application to large-scale systems at various levels • Local • Regional • National
Points to Consider • Database of highway-intensive improvements • Used as an estimate of the highway lane miles needed to accommodate traffic volume projections • Does not consider the feasibility of constructing projects to meet the identified highway needs • Comparability of MINs and highway-intensive options • Sometimes each fulfill different purposes (Port Accessibility MIN) • Equal levels of performance not always achieved by competing options • Travel time, mobility improvements • Alternative cost comparison • Incorporating maintenance costs • Lifecycle costs * Provided by Michael Fontaine and Matthew Grimes, VTRC
Points to Consider (cont) • Simple models can be problematic when making cross-modal comparisons • Hard to make solid determinations and conclusions without high-level analysis • Extensive data on studied transportation projects is needed to make accurate, quantitative comparisons between multimodal investments and single-mode alternatives • Many of the projects considered lacked such data