Download
1 / 61
610 likes | 781 Views
Market Risk Management using Stochastic Volatility Models. The Case of European Energy Markets. Outline. Preliminaries, markets, instruments and hedging Relevant risk, std, volatility + + + ….. Markets, instruments and models +++

E N D
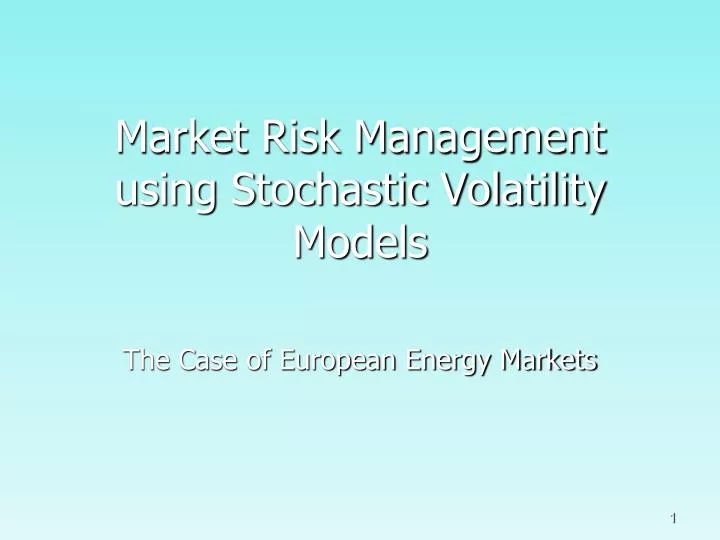
Market Risk Managementusing Stochastic Volatility Models The Case of European Energy Markets
Outline • Preliminaries, markets, instruments and hedging • Relevant risk, std, volatility + + + ….. • Markets, instruments and models +++ • Value at Risk, Expected Shortfall, Volatility and Covariances • Stochastic Volatility Models • Definition and Motivation • Projection, estimation and re-projection • The Nordpool and EEX Energy Markets • SV model q parameters • Assessment and empirical findings • Market Risk Management • SV-model forecasts and Risk Management • One-day-ahead forecasts and Risk Management • Summaries and Conclusions
Main Objectives • Forecasting Risk Management Measures • SV model forecasts of VaR, CVaR and Greek letter densities • Conditional Moments Forecasts • One-day-ahead densities of VaR, CVaR and Greek letters • Extreme value theory and VaR, CVaR and Greek letter densities
Preliminaries Portfolio Theory Basics for Investors
Preliminaries Portfolio Theory Basics (relevant risk measures):
Preliminaries The Relevant Risk issue: The observed municipal and state ownerships often coupled with scale ownership of many European energy corporations induce greater portion of wealth invested and less diversification. Risk adverse managers, stringent actions from regulators and diversification issues, relative to a perfect world, risk assessment and management methodologies as well as risk aggregation may be challenging and potentially of great value to shareholders in the European energy markets. That is: stotal versus bi = (si * sM) / sM theTraynorindex versus theSharpeindex
Preliminaries Financial Products and Markets • Financial Products / “Plain Vanilla” products • Long and Short positions in Assets • Forward Contracts / Future Contracts • Swaps • Options
Preliminaries European Energy Markets and Activity/Liquidity for 2008 -2009 (annual reports)
Preliminaries Financial Products and Positions • Hedging Positions for plain Assets Profit Long position Asset Long Positions Payoff: St – S0 Short Positions Payoff: S0 – St 0 Underlying asset (St) S0 Short position Asset Loss
Preliminaries Financial Products and Positions • Hedging Positions for plain Forward/Future Products Profit Long position Forward/Future Long Positions Payoff: St – K Short Positions Payoff: K – St 0 Underlying asset (St) K Short position Forward/Future Loss
Preliminaries Financial Products and Positions • Hedging Positions for plain buying (long) positions in Call/Put options Buying a put position Profit Buying a Call position Call position Payoff: Max(0;St – K)-c Put Positions Payoff: Max(0;K – St)-p 0 Underlying asset (St) K Loss
Preliminaries Financial Products and Positions • Hedging Positions for plain selling (short) positions in Call/Put options Profit Call position Payoff: -Max(0;St – K)+c Put Positions Payoff: -Max(0;K – St)+p 0 Underlying asset (St) K Selling a Call position Selling a put position Loss
Preliminaries • Management of Portfolio Exposures: Greek Letters The sensitivity of the portfolios value to the price of the underlying asset: The rate of change of the portfolio’s delta with respect to the price of the underlying asset: The rate of change of the value of the portfolio with respect to the volatility of the underlying asset: The rate of change of the value of the portfolio with respect to the passage of time (time decay): The rate of change of the value of the portfolio with respect to the level of interest rates:
Preliminaries • Calculation of the GREEK LETTERS Taylor Series Expansion on a single market variable S (volatility and interest rates are assumed constant) For a delta neutral portfolio, the first term on the RHS of the equation is zero (ignoring terms of higher order than Dt) (quadratic relationship between S and P): When volatility is uncertain: Delta hedging eliminates the first term. Second term is eliminated making the portfolio Vega neutral. Third term is non-stochastic. Fourth term is eliminated by making the portfolio Gamma neutral.
Stylized facts about volatility Definition of volatility (s) The standard deviation of the return (rt) provided by the variable per unit time when the return is expressed using continuous compounding. = return in time T expressed with continuous compounding When T is small it follow that is approximately equal to the standard deviation of the percentage change in the market variable in time T. Based on Fama (1965); French (1980) & French and Roll (1986) show that volatility is caused by trading itself using trading days ignoring days when the exchange is closed. T = 1 ~ 252 trading days per year
Stylized facts about volatility Fat tails of asset returns (leptokurtosis) When the distribution of energy market series are compared with the normal distribution, fatter tails are observed. Moreover, we also observe too many observations around the mean. Too little at one std dev. Third moment (≠0) and fourth moment (≠3).
Stylized facts about volatility An alternative to Normal Price Change distributions in Energy Markets The power law asserts that, for may variables that are encountered in practice, it is approximately true that the value u of the variable has the property that, when x is large: where K and a are constants. Rewriting using the natural logarithm: A quick test can now be done for weekly and yearly price changes at NASDAQ OMX energy market. We plot against lnx. The logarithm of the probability is approx. linearly dependent on ln x for x >3 showing that the power law holds.
Stylized facts about volatility Extreme Value Theory* Application for a Forward contract at NASDAQ OMX Equivalence to the Power Law (next slide) Total number of daily price change observations n = 2809, ranging from -12.62% to 16.35%. For the extreme value theory we consider the left tail of the distribution of returns. u = -4 % (a value close to the 95% percentile of the distribution). This means that we have nu=31 observations less than u. We maximize the log-likelihood function: Using the estimates (optimized): Calculation of VaR: The probability that x will be less than 15% is: The value of one-day 99% VaR for a portfolio where NOK 1 million is invested in the contract is NOK 1 million times: That is, VaR = 1 million NOK * 0.102987= NOK 102,897
Stylized facts about volatility Volatility Clustering Refer to the observation of large movements of price changes are being followed by large movements. That is, persistence of shocks.
Stylized facts about volatility Asymmetric Volatility (called leverage in equity markets) Refer to the idea that price movements are negatively (positively) correlated with volatility
Stylized facts about volatility , valid for , Long Memory (highly persistent volatility) Especially for high-frequency price series volatility is highly persistent. Therefore, there are evidence of near unit root behaviour of the conditional variance process and high persistence in the stochastic volatility process. SV modeldefinition: defined for and Co-movements in volatility / Correlations Looking at time series within and across different markets, we observe big movements in one currency being matched by big movements in another. These observations suggest importance of multivariate models in modelling cross-correlation in different products as well as markets. Implications for reliable future volatilities To get reliable forecasts of future volatilities it is crucial to account for the observed stylised facts.
Stylized facts about volatility Co-movements in volatility / Correlations
Models for volatility estimations/forecasts Time series models Options-based forecasts From traded option prices and with the help of the Black-Scholes model. Calculations and Predictions based on past Standard deviations Use the historical information only. Not based on theoretical foundations, but to capture the main features. Conditional volatility models Stochastic volatility models
Stochastic volatility Models Value at Risk (VaR): The gain during time T at the (100 – X)thpercentileoftheprobabilitydistribution. Conditional Value at Risk (VaR) (expected shortfall): The expected loss during time T, conditional on the loss being greaterthantheXthpercentileoftheprobabilitydistribution.
Stochastic volatility Models Risk management is largely based on historical volatilities. Procedures for using historical data to monitor volatility. Define n + 1 : number of observations Si : value of variable at end of ith interval, wherei= 0, 1, …, n t : length of time interval for i = 1, 2, … , n. The standard deviation of the , where s is the volatility of the variable. The variable s is, therefore an estimate of . It follows that s itself can be estimated as , where The standard error of this estimate is approximately:
Stochastic Volatility Models Correlations /Co-movements in Volatility For risk management, if changes in two or more variables have a high positive correlation, the company’s total exposure is very high; if the variables have a correlation of zero, the exposure is less, but still quite large; if they have a high negative correlation, the exposure is quite low because a loss on one of the variables is likely to be offset by a gain on the other. Define r : correlation between two variables V1 and V2 where E() denotes expected value and SD() denotes standard deviation. The covariance between V1 and V2 is and the correlation can therefore be written as: An analogy for covariance is the pervious variance/volatility.
Stochastic Volatility Models Correlations /Co-movements in Volatility and COPULAS Often there is no natural way of defining a correlation structure between two marginal distribution (unconditional distributions). This is where COPULAS come in. Formally, the Gaussian copula approach is: Suppose that F1 and F2 are the cumulative marginal probability distributions of V1 and V2. We map V1 = u1 to U1 = u1 and V2 = u2 to U2 = u2, where and N is the cumulative normal distribution function. This means that The variables U1 and U2 are then assumed to be bivariate normal. The key property of a copula model is that it preserves the marginal distribution of V1 and V2 (however unusual they may be) while defining a correlation structure between them. Other copulas is the Student-t copula Multivariate copulas exists and Factor models can be used.
A Scientific Stochastic volatility model Let yt denote the percent change in the price of security/portfolio. A stochastic volatility model in the form used by Gallant, Hsieh and Tauchen (1997) with a slight modification to produce leverage (asymmetry) effects is: where z1t and z2t are iid Gaussian random variables. The parameter vector is: REF: Clark (1973), Tauchen & Pitts (1983), Gallant, Hsieh, and Tauchen (1991, 1997), Andersen (1994), and Durham (2003). See Shephard (2004) and Taylor (2005) for more background and references.
Stochastic Volatility Models GSM estimated SV-models for NordPool and EEX European Energy Markets
Stochastic Volatility Models GSM Assessment of SV Model Simulation fit:
Stochastic Volatility Models GSM Assessment of SV Model Simulation fit:
Stochastic Volatility Models SV-model Features (2 markets and 4 contracts): NASDAQ OMX Front Week 100 k
Stochastic Volatility Models SV-model Features (2 markets and 4 contracts): NASDAQ OMX Front Week 100 k
Stochastic Volatility Models SV-model Features (2 markets and 4 contracts): EEX Front Month (peak load) 100 k
Stochastic Volatility Models SV-model Features (2 markets and 4 contracts): EEX Front Month (peak load) 100 k
Stochastic Volatility Models SV-model Features (2 markets and 4 contracts): Correlation Week/Month 100 k
SV-Models: Risk Management Excel Densities Percentiles: VaR, CVaR positions for 4 contracts 100 k
SV-Models: Risk Management EVT: VaR, CVaR Positions for 4 contracts 100 k
SV-Models: Risk Management EVT densities: VaR, CVaR Positions for 4 contracts 100 k
SV-Models: Risk Management Greek Letter densities (delta reported) for NASDAQ Week and Month 100 k
SV-Models: Risk Management Greek Letter densities (delta reported) for EEX Base and Peak Load Month Futures 100 k
SV-Models: Risk Management Bivariate Estimations: NASDAQ OMS Front Week – Front Month
SV-Models: Risk Management Bivariate Estimations: EEX Front Base Month – Front Peak Month
SV-Models: Risk Management Bivariate Estimations: NASDAQ OMX Front Month – EEX Front Base Month
SV-Models: Risk Management Forecast unconditional First Moment: VaR/CVaR measures from Uni- and Bivariate Estimations (precentiles)
SV-Models: Risk Management Forecast Second Moment: Uni- and Bivariate Estimations NASDAQ OMX Front Week
SV-Models: Risk Management Forecast Second Moment: Uni- and Bivariate Estimations NASDAQ OMX Front Month
SV-Models: Risk Management Forecast Second Moment: Uni- and Bivariate Estimations EEX Front Month (base load)
SV-Models: Risk Management Forecast Second Moment: Uni- and Bivariate Estimations EEX Front Month (peak load)
SV-Models: Risk Management Forecast Second Moment: Uni- and Bivariate Estimations NASDAQ OMX Front Week/Month