Download
1 / 66
660 likes | 816 Views
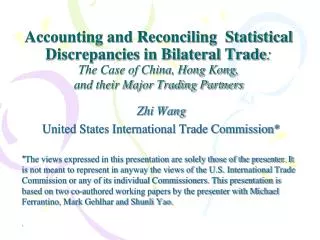
Accounting and Reconciling Statistical Discrepancies in Bilateral Trade : The Case of China, Hong Kong, and their Major Trading Partners. Zhi Wang United States International Trade Commission*

E N D
Accounting and Reconciling Statistical Discrepancies in Bilateral Trade:The Case of China, Hong Kong, and their Major Trading Partners Zhi Wang United States International Trade Commission* *The views expressed in this presentation are solely those of the presenter. It is not meant to represent in anyway the views of the U.S. International Trade Commission or any of its individual Commissioners. This presentation is based on two co-authored working papers by the presenter with Michael Ferrantino, Mark Gehlhar and Shunli Yao. .
Presentation Outline • Questions and Major Issues • Literature Review • How to measure the Discrepancies • The Method of Reconciliation • Basic Ideas of the Procedure • Brief Outline of Procedure • Six Steps in Implementation • Reconciliation Results • Conclusions and Implications
Three Related Questions • How to measure the discrepancy in trade statistics between China and its major trading partners? Could we find reasonable explanations of the discrepancies? Is the discrepancies between China reported trade statistics and US reported statistics special? • Is it possible to have a methodology to reconcile trade statistics reported by China and its major partners and to know how much good made in China really exports to the U.S. and the world? • How much does China earn from its rapidly expanding exports, in other words, how China’s exports contribute to its production of GDP and GNP? Is it significantly different from major industrial and other developing countries?
Mirror Relation among U.S. , China and Hong Kong Reported Trade StatisticsWestbound Flows + U.S. reported total exports to China (fas) U.S. Reported Total exports to Hong Kong (fas) Hong Kong reported re-exports of U.S originated goods Hong Kong’s reported re-export U.S. originated goods to other countries U.S. indirect exports to China via Hong Kong - Hong Kong reported imports of U.S originated products (cif) China reported imports of U.S. originated prodicts (cif) fob/cif adj - - fob/cif adj +
Hong Kong reported domestic exports to U.S.(fob) Hong Kong Reported re-exports of China originated goods to U.S. (fob) Hong Kong’s markup for re-export China originated goods to U.S China indirect Export to U.S. via Hong Kong = U.S. reported imports originated from Hong Kong (fob) U.S. reported imports originated from China (fob) + Mirror Relation among U.S. , China and Hong Kong Reported Trade StatisticsEastbound Flows + China reported total exports to U.S. (fob)
Mirror Relation among China and Hong Kong Officially Reported Trade Statistics and U.S Unpublished Shipping Data - Eastbound Flows
Statistical Discrepancies of China and Hong Kong Exports to Their Partners • Small discrepancies -- partner reported imports closely matched China and Hong Kong reported exports: Japan, South Korea • Positive discrepancies -- partner reported imports were more than China and Hong Kong reported exports: USA, Canada, Mexico, EU15, EU10, Norway, Switzerland,Australia, New Zealand Argentina, India, Singapore, Malaysia, and Thailand • Negative discrepancies -- partner reported imports were less than China and Hong Kong reported exports: Russia, Chile, Venezuela, Indonesia, Philippines, Brazil, Saudi Arabia, South Africa, and Sum of all other reporters The average discrepancy in 2004 is about 18 percent
Statistical Discrepancies of China and Hong Kong Exports to Their Partners, 1995-2004Sample Countries
What are some possible causes of discrepancies? • Timing – but this washes out over the long run • Shipping and insurance costs – we correct for these, but not perfectly • Classification – HS 98 and 99, and other problems (we omit these from the analysis)
Literature Review:International Trade Statistics The “Hong Kong re-export” explanation of the “mismatched mirror” between China and the United States has served well for awhile. It has focused attention on Hong Kong, and on such issues as the “Hong Kong markup” (Feenstra and Hanson (2003)). But in the 21st Century the mirror appears to be breaking again.
Special problems with re-exports • The ultimate origin and destination can become confused • Usual practice – Importer records country of origin, exporter records country of shipment (*old* Hong Kong explanation) • Exporter may not always know when goods are re-sold (middlemen) • Confusion with goods in transit
General vs. special trade, and goods in transit • General trade – the physical territory • Special trade – the economic or customs territory • Not internationally standardized • U.S. has both systems • General trade – General imports, total exports • Special trade – Imports for consumption, domestic exports • Total exports = Domestic exports + foreign exports (re-exports) • Goods in transit (transshipment), e.g. boats being loaded and unloaded without goods clearing customs, are *not* re-exports, but can be confused with them
Mis-invoicing, transfer pricing, and mis-attribution • Under- and over-invoicing can be used to evade tariffs or other taxes • Transfer pricing – mis-invoicing by multinational firms • Mis-attribution – mis-stating of origin or destination • Special policies (FTAs, TRQs) may give further incentives • Could be accidental or intentional • Different types of firms, policies, etc. may behave differently • Smuggling – is like under-invoicing at P = 0 (sort of). If it leaves no record on either side, it is undetectable by mirror methods
What We find in preliminary Econometric Work • The robust correlates of the eastbound discrepancy are • Valuation problems (a 1 percent increase in missing valuations = 0.13 to 0.37 increase in the discrepancy) • Time (the discrepancy increases by 0.9 to 1.5 points per year, ceteris paribus) • U.S. tariffs (a 1-point ad valorem increase in U.S. tariffs is associated with 0.34 to 1.41 decrease in the discrepancy, except in fixed effects) • U.S. re-exports (a 1 percent increase in the re-export share is associated with 0.04 to 0.60 decrease in the discrepancy) • The other regressors vary a lot depending on weighting, outliers, and fixed effects. Some of them look big
Major Problems in Bilateral Trade Statistics Reconciliation • No consistency condition has been defined in the presence of re-exports via third countries • No global consistency has been imposed • No adjustment at sector level has been done • Substantial inconsistencies still exist after adjustment even at aggregate level
Trade Balances Reported by China and its Partners by GTAP Sectors, Billions of US Dollars, 2004 Data Source: USITC Oracle database and China Customs Trade Statistics
China and U.S. Merchandise Trade Balance Reported and Adjusted, 1989-2005 Data Source: Fung, K C, Lawrence Lau, and Yanyan Xiong, 2006 “Adjusted Estimates of United States-China Bilateral Trade Balances—An Update,” Pacific Economic Review, vol 11(3), pages 299-314, October
Objectives • Develop and implement a globally consistent procedure to reconcile bilateral trade statistics in the presence of re-exports via third countries • Apply the procedure to 2004 trade statistics in GTAP sectors to produce Hong Kong re-exports-adjusted bilateral trade flows between China, Hong Kong and their major trading partners contributing to version 7 GTAP database
Basic Ideas of the Procedure • Initial estimates of the same economic variables from different sources • A set of well defined consistency conditions and other constraints • Reliability information on the initial estimates
Problems of Proportional Adjustment in International Trade StatisticsChina & Hong Kong reported exports and partner reported imports, 2004, Million Dollars
Problems of One-Size for All in CIF/FOB MarginBilateral Margins Depend on Product Composition of Sector • Example: GTAP Sector 42 ‘other manufactures’ • HS chapter 71-high value goods: diamonds, precious stones • HS chapter 95-low value goods: toys games and sporting goods • China exports very large proportion of toys: high transport margin > 8 percent • India exports very large proportion of diamonds: low transport margin <1 percent
Problems of One-Size for All in CIF/FOB Margin Bilateral transport margins on selected U.S. import flows for other manufacturers Source: U.S. Census, foreign trade statistics using transport costs (c.i.f. / customs value). Note: HS categories of high unit value goods consist of precious stones, metals, and jewelry categories in low unit value goods are primarily toys, sporting goods, and accessories.
Key Assumptions • Hong Kong is the only entrepot between China and its partner countries • All reporting countries, including China, can correctly identify the country of origin of their imports, whether the imports are directly from the partners or indirectly from Hong Kong
Consistency Constraints in the Model • Five for exports from China & Hong Kong • Five for exports to China & Hong Kong • Four for China-Hong Kong bilateral trade • Two for China’s & Hong Kong’s exports to and imports from the world
The Adjustment Problems Adjust a given set of initial trade statistics according to the following objective function to satisfy the 16 consistence constraints:
Theoretical Properties • Statistical interpretations underlying the model differ when different reliability weights are used • Estimation of Hong Kong’s re-export markups, rearrange sources and destinations of China’s and Hong Kong’s exports and imports, adjust bilateral trade balance for China and all its partners are made in a consistent simultaneous manner, thus impose global consistence to the adjusted trade data • In all but the trivial case, posterior estimates derived from entropy or quadratic loss minimand will always be closer to the unknown, true values than the associated initial statistics • The choice of weights in the objective function has a large impact on the estimation results
D0: Initial estimates W variance matrix of initial estimates , A coefficient matrix of all linear constraints AD* = 0 The BLUE : D* will never be worse than D0 with equal or smaller variance Why Adjusted Estimates Better?
Empirical Advantages • Convenience and details • Hong Kong's re-export markup rate, each country's re-exports via Hong Kong as percent of the country's total exports, and adjusted bilateral BOT between China, Hong Kong and their partners all are part of the model solution • Completeness • Complete use of all information from official trade statistics • Flexibility • The model permits a wider variety and volume of information to be brought into the adjustment process than is possible with scaling methods such as RAS • Incorporation of data reliabilities in a systemic way • The weights in the objective function reflect the relative reliability of a given trade flow. Trade statistics with higher reliability should undergo less adjustment than trade statistics with lower reliability
Six Key Steps to Implement the Procedure 1 Obtain initial estimates from observed data 2 Decide country and commodity aggregation 3 Calculate initial Hong Kong re-export markups 4 Estimate fob/cif margins 5 Chose and estimate reliability weights 6 Determine global consistent world exports and imports by China and Hong Kong
Observed and Derived Trade StatisticsEast bound trade Observed • China’s direct exports to partner countries • Hong Kong’s total exports to partner countries • Partner’s total imports from China • Partner’s imports of product originated from Hong Kong Derived • China’s total exports to partner countries • Hong Kong’s domestic exports to partner countries • Partner countries’ direct imports from China • Partner countries’ total imports from Hong Kong
Observed and Derived Trade StatisticsWest bound trade Observed • Partner countries total exports to Hong Kong • Partner countries direct exports to China • China’s total imports from partner countries • Hong Kong’s total imports from partner countries Derived • Hong Kong’s imports from partner countries for domestic use • China’s direct imports from partner countries • Partner countries’ total exports to China • Partner countries’ exports for Hong Kong’s domestic market
Data Source • All data are from 1995-2004 • China: Customs General Administration, 8-digit Harmonized System (HS) • Hong Kong: Census and Statistical Department, 8- digit HS • United States: Census Bureau, 10-digit HS; • Other Partner Countries: World Integrated Trade Solution (WITS) managed by the World Bank, 6- digit HS, more than 150 reporting countries.
Country and Commodity Aggregation • 42 GTAP merchandise sectors aggregated from original data at 6 and 8 digit HS level • 215 countries identified in the GTAP global bilateral trade data base, while only 157 countries reported at least one year of their exports to or import from China and Hong Kong during 2002 to 2004 • First aggregate all the non-reporting country into one block • Then use two cut off criteria to separate the 157 reporting country into two blocks. The first block has 96 countries, including all single countries in version 6 GTAP database and the sum of exports from China and Hong Kong to the world greater than 300 million dollars in 2004 identified either by China and Hong Kong reported data or their partner reported data. • The second block is consisted of 61 remaining reporting countries, which aggregated to one other reporting country block. • Include China and Hong Kong, the model has 98 countries.
Characters of the Initial Data • Reported westbound trade is less problematic than reported eastbound trade. (24 of the 96 reported bilateral routines with more than 90% discrepancies in eastbound trade, only three routines in the westbound trade see such large discrepancies) • Trade with developing country partners shows greater discrepancies than developed countries in general • Small trade flows often associate with large discrepancies than large flows. Extremely large discrepancies come from partners only have small trade values
Reliability of Reported Trade Statistics • Mirror trade statistics are the major data source to estimate the reliability weights • Econometric analysis of discrepancies between the two "reported" trade data of the same trade flows provide estimates of data reliability
Auto regression with dummy variables e: mirror trade statistics discrepancies b: symmetric bias D: dummy variables. Represent events have a significant impact on the reporting practice in the two reporting countries the variance:
Route Specific Reliability Indexes • The initial trade flow estimates of the model can be used to construct such indexes: • It has a value between 0 and 2. A smaller value indicates the initial estimates are relatively reliable for the associated trade routine.
Reporter Specific Reliability Indexes • All bilateral trade data in the world need to be used to construct the reporter specific reliability indexes • It has a value between 0 and 1. A large value indicates the initial estimates reported by the country are relatively reliable for its reported exports or imports than other reporters • The weights in the objective function of the model can be assigned by multiplying one minus the indexes by their corresponding initial values
Global Consistent Total Exports to and Imports from the World by China and Hong Kong • A quadratic programming model to reconcile IMF country aggregate merchandise trade and country reported exports & imports at GTAP sector level from UN COMTRADE • Data on global total exports and imports of primary commodities from FAO, USDA were incorporated • The degree of adjustment depends on reporter’s reliability China and Hong Kong’s total export to and import from the world at each GTAP sector from this model were taken into the bilateral model as control totals
Reporter Reliability and Percentage of AdjustmentIMF country total exports, 2004
Reporter Reliability and Percentage of AdjustmentIMF country total imports, 2004
Reporter Reliability and Percentage of AdjustmentWorld exports by GTAP sectors, 2004
Reporter Reliability and Percentage of AdjustmentWorld imports by GTAP sectors, 2004
Reporter Reliability and Percentage of AdjustmentIMF country total imports, 2004