Download
1 / 3
30 likes | 143 Views
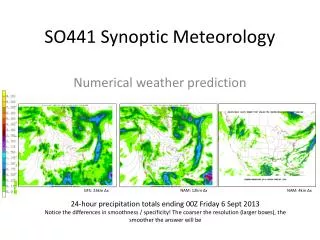
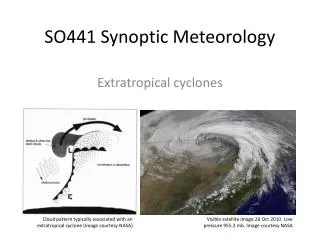
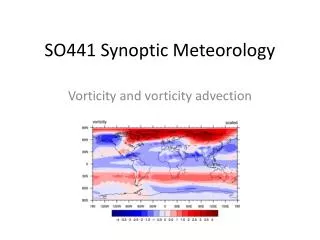
SO441 Presentation Tips. Be as technical as possible Use the tools presented in this course Weather charts, satellite images, upper-air soundings

E N D
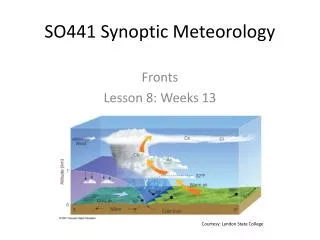
SO441 Presentation Tips • Be as technical as possible • Use the tools presented in this course • Weather charts, satellite images, upper-air soundings • A good presentation will be 75-80% based on these graphics (created by you not by the NWS meteorologist whose case study you found online and decided to co-opt to be your SO441 presentation) • Every graphic you present that you do not create must have a citation! • Use the concepts presented in the course liberally • QG theory • If there is precipitation, there’s a good bet it is (at least in some way) connected to QG theory • Cyclogenesis • If a low pressure center strengthened, then talk about why! Use the theory presented in the course notes • Upper-levels projecting onto the surface • TC motion and thunderstorm motion are due to upper-level steering currents. Pick a level and show them if they’re important to your event. • Upper-level trough moving over a surface front incudes cyclogenesis which leads to temperature advection which causes precipitation: show this! • But: if you haven’t learned it from me this semester, be very careful using it, because it might not be true • Example: “Warm air collided with cold air to produce weather.” Be more specific! Furthermore, what do you mean by “weather”?
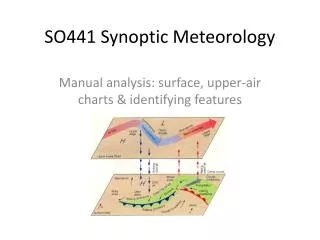
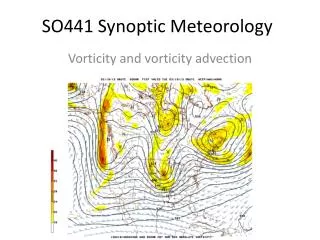
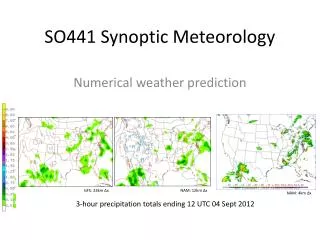
Better choice: presents lots of surface information and some analysis Not a very strong graphic
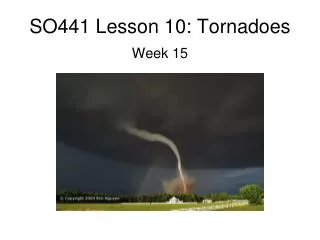
SO441 Presentation Tips • Less is more • Each chart/image you present must be analyzed in detail • Do not aim to throw up dozens of images in the hope that we will glean a message from them • Rather take several levels (surface, 850, 700, 500) and carefully point out the salient features • Use multiple layers (station model + contours, or wind barbs & contours, etc.) • You probably do not need to go backward in time more than about 36-48 hrs. Don’t just add graphics to fill your 10-min window. Every image you show must be part of the overall story. • Annotate slides clearly using PPT tools. We should not have to squint to read the graphics. If you can’t make it legible, don’t include it