Download
1 / 90
930 likes | 1.12k Views
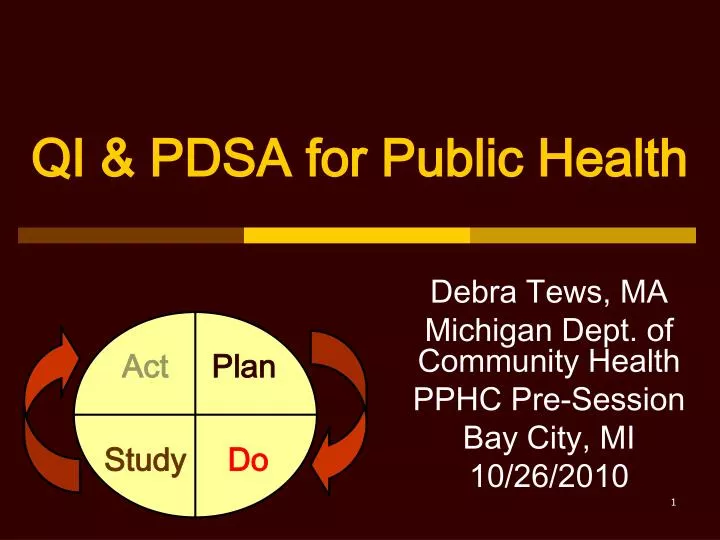
Act. Plan. Study. Do. QI & PDSA for Public Health. Debra Tews, MA Michigan Dept. of Community Health PPHC Pre-Session Bay City, MI 10/26/2010. Today’s Focus. A brief overview of QI including PH definitions for Quality and QI

E N D
Act Plan Study Do QI & PDSA for Public Health Debra Tews, MA Michigan Dept. of Community Health PPHC Pre-Session Bay City, MI 10/26/2010
Today’s Focus • A brief overview of QI including PH definitions for Quality and QI • An intro to PDSA from Michigan’s Quality Improvement Guidebook • An intro to QI tools
What is Quality in Public Health? “Quality in public health is the degree to which policies, programs, services and research for the population increase desired health outcomes and conditions in which the population can be healthy.” Public Health Quality Forum
So How Can One Define Quality Improvement for Public Health? Use of a deliberate and defined improvement process, such as Plan-Do-Check [Study]-Act, which is focused on activities that are responsive to community needs and improving population health. Itrefers to a continuous and ongoing effort to achieve measurable improvements in the efficiency, effectiveness, performance, accountability, outcomes, and other indicators of quality in services or processes which achieve equity and improve the health of the community. Accreditation Coalition 2009
Why QI in Public Health? Tough Economic Times Require a Different Approach! QI Can: • Reduce costs and redundancy • Eliminate waste • Streamline processes • Enhance ability to meet service demand • Increase customer satisfaction • Improve outcomes
Is it QI or is it QA? Quality Improvement GOES BEYOND Quality Assurance!
Doing Both? • QUALITYASSURANCE relates to Monitoring & Compliance. It GUARANTEES quality. Standards met? Deficiencies corrected? QA is . . . . . reactive! • QUALITY IMPROVEMENT relates to Learning & Improving. It RAISES quality. Quality can’t always be assured. Ongoing efforts to identify opportunities for improvement are needed. QI relies on measurement & data-driven decisions to improve outcomes. QI is . . . . . proactive!
Principles of QI From the Public Health Memory Jogger Pocket Guide of QI Tools: • Develop a strong customer focus • Continually improve all processes • Involve employees • Mobilize both data and team knowledge to improve decision making
Three Key Questions !!! 1. What are we trying to accomplish? 2. How will we know that a change is an improvement? 3. What changes can we make that will result in improvement?
Change Vs. Improvement Edwards Deming: Of all changes observed, about 5% were improvements, the rest at best were illusions of progress! To move beyond illusions of progress, a QI method (PDSA) and QI tools are needed. Embracing Quality in Local Public Heath: Michigan’s QI Guidebook explains the PDSA method and suggests tools.
Act Plan Study Do Snapshot: Plan-Do-Study-Act (PDSA)
Some Common Tools of QI • Process Mapping • Cause and Effect/Fishbone Diagrams • Five Whys • Run Charts • Pareto Charts • Check Sheets Understand Your Process & Make Sense of Your Data!
QI: Assembling the Pieces • Listen to LHD customers • Use data to make data-driven decisions • Continually improve processes in your LHD • Use recognized QI methods and tools • Work together; a team approach is best. • Ask the 3 Key Questions!
What Do Users Say? • “We now have staff eager to use the same tools/methods to evaluate performance and make improvements in other areas of our work” MLC-3 LHD • “The PH focus of the Guidebook helps with the application of QI methods; it becomes ‘real’ for participants . . . we can ‘look through our public health windows’” Allegan LHD • “For any PH agency interested in learning QI and how PH can apply these principles/methods, I would recommend they start with this Guidebook” Saginaw LHD • “The Guidebook has been a road map for our team as we navigate our way down this new path of improving our processes” MMDHD “I refer to the Guidebook often even though I know the steps” MI Mentor
There’s More . . . • “The Guidebook has been incredibly useful for QI work, serving as the primary textbook for teaching QI throughout the department” MI Mentor • “The Guidebook helps with capacity building . . . it would not be possible to spread QI methodologies easily without it” Muskegon LHD • “The Guidebook is used in our QI meetings as an effective discussion and clarification tool; it generates comfort levels” Allegan LHD “The Guidebook is the glue that holds the whole effort together” MI Consultant
QI Resources for Public Health www.accreditation.localhealth.net and www.phf.org
Another Resource for QI Tools • http://www.langfordlearning.com
Using QI Tools There are many tools that can help you meet the goal of improving your work processes and services
PDSA and Using QI Tools • Using tools as part of the PDSA cycle • Some tools will be useful in the planning stage • Others will help you to implement your QI project • And/or will help you study the impact of your process change
Useful QI Tools • Process Mapping • Check Sheets • Pareto Charts • Cause and Effect Diagrams • Fishbone Diagrams • The 5 Whys • Run Charts
Sometimes called Flow Charting… Process Mapping
QI Works on Existing Processes • A process is a series of steps or actions performed to achieve a specific purpose • It describes how things get done • Your work is made up of many processes
What is a Process Map? • A pictorial representation of the sequence of actions that describe a process
Why is Process Mapping Important? • It’s an opportunity to learn about the work being done • It involves documenting the obvious, as well as all that which goes without saying • Helps to discover inconsistencies • Most processes today are undocumented • Helps to control the “evolution” of a process
Process Maps are Used To • Document the way we do our work • Analyze and improve on processes
How Do We Prepare to Process Map? (1) • Assemble the QI Team • Agree on the process you want to document • Agree on the purpose of the process • Agree on beginning and ending points
How Do We Prepare to Process Map? (2) • Agree on the level of detail to be displayed • Begin by preparing an outline of steps • Identify and recruit other people that should be involved
What are the Symbols Used in Process Mapping? • Start and End of the Process: • A process Activity: • A process Decision: • A Break in the process:
Helpful Tips to Keep in Mind • Process Map what is, the actual process • Process Mapping is dynamic • Clearly define the boundaries of the process
Example: Process Map of Conference Approvals Process • Do a Process Map that documents the process used to obtain approval to attend conferences.
More Useful Tips • Other exercises can help you identify the process you want to map • There is no single right way to Process Map • Process Mapping is not an end in itself • Process Maps, once created, can be useful in a variety of settings
Summing Up Process Mapping • We Process Map to learn • We Process Map to document a baseline of performance • We Process Map to discover where data may be hiding
QI Scenario: Process Mapping Exercise • Highlighting Excellence Health Department • Improvement sought-Improved Customer Satisfaction with health department services • Improve performance connecting clients with services • Please take a moment to read the Scenario write-up that is in your handouts
Observing a Process Check Sheets
What is the Purpose of a Check Sheet? • To turn observational data into numerical data • From records • Newly collected • To find patterns using a systematic approach that reduces bias • Use check sheets when data can be observed or collected from your records
Check Sheets Step by Step (1) • Step 1 • Decide what to observe • Define key elements • Establish shared understanding • Step 2 • Identify where, when, & how long • Think about confounding factors • That you want to eliminate • That you want to study
Check Sheets Step by Step (2) • Step 3 • Design your check sheet • Develop a protocol
Check Sheets Step by Step (3) • Step 4 • Identify and train your observers • Practice & adjust • Step 5 • Collect data • Review & adjust • Step 6 • Summarize data across observations & observers • Study the results
Tips for Using Check Sheets • Make sure you’re getting clean data • Define, train, check, adjust, & repeat! • Consider and address potential sources of bias • Use “other” categories sparingly • Strike a balance • Fine vs. inclusive categories • Few vs. many categories
Check Sheet Exercise (1) • When customers report dissatisfaction with LHD services, staff track the primary reason for customer complaints • They believe dissatisfaction may be caused by several conditions that they can document • Use your handout to set up the check sheet for this situation
80% of the problem Pareto Charts
What is the Purpose of Pareto Charts? (1) • To identify the causes that are likely to have the greatest impact on the problem if addressed • “80% of the effects come from 20% of the causes” • To bring focus to a small number of potential causes
What is the Purpose of Pareto Charts? (2) • To guide the process of selecting improvements to test • Use when you have, or can collect, quantitative or numeric data on several potential causes
Pareto Charts: Step by Step (1) • Step 1 • Identify potential causes of the problem you wish to study • Step 2 • Develop a method for gathering your data • Historical data • Collection of new data
Pareto Charts: Step by Step (2) • Step 3 • Collect your data • Each time the problem occurs, make note of the primary cause • Step 4 • Order your results & calculate the percentage of incidents that fall into each category