Download
1 / 53
550 likes | 636 Views
Social Inequality, Psychosocial Factors and CHD: What Have We Learned from the Research in Rich Countries? John Lynch Department of Epidemiology, Biostatistics and Occupational Health McGill University, Montreal, Canada PURE - Dubai, January 2006.

E N D
Social Inequality, Psychosocial Factors and CHD: What Have We Learned from the Research in Rich Countries? John Lynch Department of Epidemiology, Biostatistics and Occupational Health McGill University, Montreal, Canada PURE - Dubai, January 2006
What have we learned from social epidemiology? The Social Gradient in CHD CHD Rate / 100K Social Disadvantage Social Advantage
*Adjust for smoking, blood pressure, cholesterol, overweight etc 2.6 35% 2.3 1.8 The First Whitehall Study 4.0 3.2 RR 2.1 Rose and Marmot. Br Heart J (1981)
“The social class difference was partly explained by known coronary risk factors: men in the lower grades smoked more and exercised less, they were shorter and more overweight, and they had higher blood pressures and lower levels of glucose tolerance. Most of the difference, however, remains unexplained. It seems that there are major risk factors yet to be identified, …” Rose and Marmot (1981, p.13)
“… if these aspects of lifestyle account for less than a third of the social gradient in mortality, what accounts for the other two thirds? The second question occupies the rest of this book.” (p. 45 of 320) Marmot (2004)
Implications (1) • There must be other mechanisms at the individual and contextual level that generate social gradients in CHD such as stress, job control, autonomy, social participation, neighborhood effects, social capital, etc. • i.e., a range of psychosocial factors
Psychosocial factors in social epidemiology Stress Sense of Coherence Hardiness Optimism John Henryism Job Strain Ways of Coping Anxiety Self esteem Resilience Social cohesion Social capital Type A Behavior Pattern Cynical Distrust Anger/Anger-in/Anger-out/ Hostility Social Isolation Social Support Control Sense of Control Mastery Hopelessness Depression CHD
Implications (2) 2. Interventions focused on health behaviors and conventional risk factors are unlikely to appreciably reduce the social gradient in health. For instance, a 1998 JAMA study that has been cited more than 200 times (Web of Science), stated that, “Thus, public health policies and interventions that exclusively focus on individual risk behaviors have limited potential for reducing socioeconomic disparities in mortality.” (p. 1707) Behaviours do not matter Behaviours matter but they are just not the “big story” The downplaying of behaviours and their physiological correlates in understanding social inequalities in CHD influences research, funding, interventions and policy.
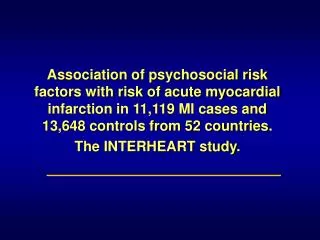
Control Depression Stress behaviours P-N-E Immune Function Social Inequality Traditional Risk Factors CHD INTERHEART: PAR ~ 75%
What have we learnedfrom CHD epidemiology? • Conventional risk factors – smoking, hypertension, dyslipidemia and diabetes do explain most CHD in populations • INTERHEART study (2004) show PAR for 4 conventional risk factors is 76% • Emberson, Whincup, et al (2005) in BRHS show smoking, blood pressure and cholesterol account for 81% PAR (adjusted for regression dilution bias) • Stamler (1992,1999) and Greenland (2003) show that 75-100% of all CHD cases occur among those exposed to at least one conventional risk factor
A Paradox? So how can it be that the factors accounting for most CHD in a population do not seem to account for most of the social gradient in CHD, when the social gradient simply emerges from sub-grouping the population according to some indicator of social position?
Lipids, hypertension, smoking, diabetes A Paradox? 1000 cases of CHD Most educated 100 Middle educated 300 Least educated 600
An Illustration • Population sample of 2,682 Finnish men – Kuopio IHD Study • Stratified the population into lower and higher risk groups based on standard clinical definitions - current smoking, hypertension, dyslipidemia and prevalent diabetes • 34.7% were current smokers, 58.7% had hypertension, 42.7% had dyslipidemia, 6.5% had diabetes, and 84.9% had at least one of these risk factors • Fatal (ICD9 codes 410-414) and nonfatal CHD, classified according to MONICA criteriia • There were 425 CHD events (108 fatal, 317 non-fatal) during an average follow-up of 10.5 years. Lynch, Davey Smith, Harper, Bainbridge. J Epidemiol Community Health (in press)
Accounting for Cases of CHD in this Population • Of the 425 total cases - 402 (94.6%) occurred among men exposed to at least one of the four conventional risk factors • 70%+ of cases occurred in men with at least 2 risk factors • PAR ~ 70% • Similar to INTERHEART (PAR ~ 75%) and with US cohorts where 90%+ of cases occur among those exposed to at least one conventional risk factor • Thus these results are consistent with the idea that • conventional risk factors DO EXPLAIN the vast majority of CHD cases
Accounting for the Social Gradient in CHD in this Population • Social gradient in CHD comparing high to low education is RR = 1.90 • After adjustment for conventional risk factors RR = 1.68 • This corresponds to a 24% reduction in the excess RR • Thus these results are consistent with the idea that • conventional risk factors DO NOT EXPLAIN the social gradient in CHD
What would population levels and social gradients in CHD look like if there were no conventional risk factors in this population?
Whole KIHD Population N = 2,682 Low Risk Segment of KIHD Population N = 404 (15.1%)
Excess Risk (whole pop) = 88 per 1000 Excess Risk (“low risk” pop) = 25 per 1000 Make it a low risk pop = 72% reduction in the excess risk of social inequality in CHD 194 RR = 1.8 143 CHD Risk / 1000 106 66 60 RR = 1.6 41 Low risk population Low risk population Low risk population
In a low risk population with no smoking, hypertension, dyslipidemia and diabetes • Relative social gradient in CHD remains • RR = 1.8whole vs 1.6low risk • Absolute social gradient is reduced by 72% • ER = 88whole vs 25low risk per 1,000
Which social inequality is “better”? Original social inequality in CHD Give the disadvantaged the same risk factor levels as the most advantaged CHD Rate / 100K If we intervened to substantially reduce risk factors in all social groups Social Disadvantage Social Advantage
Within an absolute risk framework, there is no paradox between the observations from CHD and social epidemiology. Conventional risk factors do account for most CHD and for most of the absolute social gradient in CHD (72% of the excess risk). • However, when explaining relative social gradients in CHD, the apparent paradox may arise that the factors which explain most cases of CHD do not explain the relative social gradient. • Adjustment for conventional risk factors only reduced the relative social gradient in CHD by 24%. This is normally interpreted to mean that most of the effects of social inequality on CHD do not work through mechanisms linked to conventional risk factors.
What does it take to be a confounder? • The extent to which a 3rd variable reduces the RR in an exposure-outcome association (an indication of confounding of the association) depends on the relative distributions of the exposure over strata of the 3rd variable and the strength of its association with the outcome. • In this case there is a more extreme relative distribution of education over strata of hopelessness than over strata of the conventional risk factors (partly because the prevalence of conventional risk factors is high), and so hopelessness/depression appears to be a stronger confounder (in this case interpreted as a mechanism) of the association between education and CHD.
Depression Education 28% Social Gradient RR=1.9 24% Conventional Risk Factors CHD on the basis of the adjusted RR analysis we would normally interpret hopelessness/depression as an important mechanism in the causation of the social gradient in CHD
How important are these 2 mechanisms? • intervene to eliminate hopelessness / depression • reduces the relative social gradient 28% • eliminates 14% of CHD cases (confounded estimate) • intervene to eliminate smoking, hypertension, dyslipidemia and diabetes smaller reduction in the relative social gradient – 24% eliminate 90%+ of CHD cases and 72% of the absolute social gradient
72% reduction in ER is an underestimate because “low risk” population is not really low risk • No differences in blood pressure and have higher BMI • but low risk population has ex-smokers, higher cholesterol and LDL, and are 5 cm shorter
Deciding on the “importance” of various risk factors for elucidating the mechanisms behind social gradients in CHD cannot be done on the basis of relative comparisons alone. • As Geoffrey Rose commented: • “Relative risk is not what decision-taking requires … relative risk is only for researchers; decisions call for absolute measures.” p. 19, Strategy of Preventive Medicine.
Black Absolute Inequality White Black – White Inequality in Infant Mortality over the 20th Century, USA Relative Inequality Black White
Age-specific Mortality Differences between the Richest and Poorest 20% of the World’s Population RR Poorest 20% Mortality Rate per 1000 RR Richest 20% Gwatkin (2000)
Explaining and reducing relative social gradients in CHD is a legitimate and important focus of research and intervention because it can help reveal novel CHD risk factors and mechanisms that are unevenly distributed across social groups. • However, explanations for relative social gradients need to be understood within the context of what causes most cases of CHD. Otherwise they may deflect attention from the most important population-level causes. • Rose – if everyone in the population smoked we would be finding that radon or asbestos were the most important causes of lung cancer
In populations where the prevalence of conventional risk factors is high, it is possible that there are no or small social gradients in those risk factors such that they cannot account for relative CHD differences across social groups but contribute substantially to the absolute risk of CHD in all social groups. • In the Whitehall Study there are small social differences in blood pressure and no social differences in total cholesterol • So reducing major, high prevalence risk factors from the population may have little effect on the relative social gradient but a large effect on the absolute social gradient as indicated by a reduction in the excess risk.
Importantly, this also means that whatever proximal (CRP) and distal factors (social capital) are identified as causes of the relative social gradient in CHD, if their behavioral and biological mechanisms do not involve conventional risk factors then they probably account for a small proportion of CHD cases.
behaviours P-N-E Immune Function Social Inequality Control Depression Stress ? Traditional Risk Factors CHD INTERHEART: PAR ~ 80%
Income Inequality, Poverty and Heart Disease: 1900-2000, USA poverty income inequality heart disease
Race-specific Voting Participation in Presidential Elections and age-adjusted, all-cause mortality, USA, 1968 - 1998 White Voting Black Mortality All-cause mortality per 100,000 % Voting in Presidential elections White Mortality Black Voting Year Lynch and Davey Smith (2003)
Sex-Specific Smoking Trends and Heart Disease, 1900-1998, USA Male Heart Disease Per Capita Consumption AADR Male Smoking Female Heart Disease Female Smoking
Sex-Specific Smoking Trends and Income Inequality, 1900-1998, USA Male Smoking Income Inequality Female Smoking Gini Per Capita Consumption
Sex-Specific Cholesterol Trends and Income Inequality, 1980-2002, USA Male Cholesterol Gini Female Cholesterol Total Cholesterol Trends from Minnesota Heart Survey: Arnett et al. Circulation (2005)
Conclusion • We should re-affirm that smoking, hypertension, dyslipidemia and diabetes are the most important causes of CHD in populations and of social gradients in CHD. • If our concern is to reduce the overall population health burden of CHD and the population health burden of CHD inequalities, then reducing conventional risk factors will do the job. • Eliminating the social gradient in CHD attributable to non-traditional risk factor mechanisms will make a modest contribution to improving overall population health because the magnitude of the between social group CHD differences is small relative to the total risk variation in the population and to that due to traditional risk factors.
Conclusion We should increase our efforts to find ways to influence the multiple pathways from international, national and local policy through to individual behaviour that will reduce conventional risk factors among current and future generations in richer and poorer countries.
Individual and Population Level Causation Issues for PURE
Black Africans Coloured White CHD SEP Risk Factors SEP ? Stress SEP INTERHEART Psychosocial – CHD PAR ~ 30% CHD Psychosocial “Heart Disease” Steyn, et al Circulation (2005) All Stroke
PURE Social, economic, demographic, behavioural transition Major Risk Factors Social Inequality CHD Psychosocial Factors Reporting Tendency
Disease Trends Populations Sub-groups Individuals Biology Genetics Triangulating Epidemiology Populations Sub-groups Individuals Biology Genetics Disease
2) Social inequality and levels of CHD after reduction in social inequality and/or psychosocial causes? 3) Social inequality and levels of CHD after population-wide reductions in risk factors? Which social inequality is “better”? 1) Original population levels and social inequality in CHD CHD Rate / 100K Social Disadvantage Social Advantage
Implications for Research on Human Growth and Development • in terms of CHD and probably many other diseases as well, we should focus on the developmental influences (political, economic, social, psychological, biological, genetic) on population levels and social inequalities in the major health behaviors in rich and poor countries
Important to reiterate Geoffrey Rose • The causes of individual cases of CHD. • The positive predictive value for individual risk prediction is very low because lots of people with conventional risk factors don’t get CHD • – what makes people susceptible to the risk factors? • Vs
Risk of CHD and Lung Cancer by Smoking Status CHD (fatal or non-fatal) Lung Cancer Death Current or Former Smoker 172 / 1000 15 / 1000 Never Smoker 12 / 1000 0
Vs • The causes of population levels of CHD • Almost all cases of CHD do have the conventional risk factors and so population levels almost completely accounted for 3-4 conventional risk factors • Thus eliminating the risk factors eliminates the disease
“If causes can be removed, then susceptibility ceases to matter” Geoffrey Rose