Download
1 / 95
970 likes | 1.24k Views
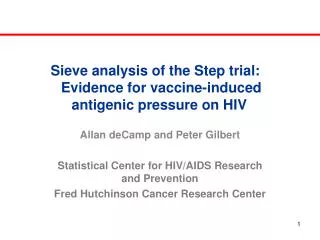
Sieve Analysis of HIV Sequences in the Step HIV Vaccine Trial. Peter Gilbert Vaccine Infectious Disease Institute Fred Hutchinson Cancer Research Center 27 May 2009. Coworkers. McCutchan lab Francine McCutchan* Sodsai Tovanabutra Eric Sanders-Buell Meera Bose Andrea Bradfield

E N D
Sieve Analysis of HIV Sequences in the Step HIV Vaccine Trial Peter Gilbert Vaccine Infectious Disease Institute Fred Hutchinson Cancer Research Center 27 May 2009
Coworkers • McCutchan lab • Francine McCutchan* • Sodsai Tovanabutra • Eric Sanders-Buell • Meera Bose • Andrea Bradfield • Annemarie O’Sullivan • Jacqueline Crossler • Teresa Jones • Marty Nau • Jerome Kim • Merck • DaniloCasimiro • Michael Robertson • HVTN • John Hural • David Chambliss • Patricia Dodd • Nicole Frahm • David Friedrich • Julie McElrath • Mullins lab • Dana Raugi • Stefanie Sorensen • Jill Stoddard • Kim Wong • Hong Zhao • Laura Heath • Morgane Rolland • Jim Mullins • SCHARP • Peter Gilbert • Allan deCamp • Fusheng Li • Craig Magaret • Steve Self • Plus thanks to David Nickle & David Heckerman • *Now at the Gates Foundation
Merck’s Ad5 Trivalent Vaccine • Vaccine: 1:1:1 admixture of 3 Ad5 vectors • Encoded transgenes: codon-optimized, near-consensus clade B HIV-1 sequences • Placebo: vaccine dilution buffer without Ad5
Cumulative Number of HIV Infections Cases accrued as of Oct 17, 2007 Primary study results reported in Buchbinder et al. (2008, Lancet) Surprising result: The vaccine may have increased the risk of HIV 2-tailed p-value = 0.077
No Vaccine Effect on Viral Load • No difference between vaccine and placebo groups (p = 0.441)
Assess the genetics of the HIVs that infected the trial participantsAre the viruses different depending on whether a subject got vaccine or placebo?
Potential effects of CTL-based vaccines X Vaccine blocks infection Vaccine blocks specific variants X CTL-driven evolution
Given the failure of the vaccine to block infection: • Our Overriding Questions Become: • Can we detect a “sieve” effect on the virus founder, in which some strains are blocked, presumably due to strain-specific immunity? • Can we detect selection on the evolving viral population, presumably due to anamnestic responses deriving from vaccine immunization and subsequent infection? • Sequence viral genomes from infected vaccine and placebo recipients • Compare overall viral protein sequences in infected volunteers • Restrict analysis to predicted viral epitopes and compare sequences to vaccine • Use placebo recipients as control for these comparisons • Methods: • Amplify and directly sequence 5-10 individual, near-full-length (9.1kb) viral genomes • Assess phylogenetic tree structure, diversity, divergence from vaccine, selective pressure • Assess conservation of predicted epitopes shared between vaccine and infection founder
Mullins Laboratory Overview • 93 volunteers infected until Dec. 2007 • Plasma samples available from 88 • 51 Vaccine, 37 Placebo • Samples from 68 individuals were PCR positive: • 39 Vaccine, 29 Placebo • WG sequences derived from 66 volunteers: • Near-full-length (9.1kb) genomes • Single half-genomes from 2 volunteers • First target was 5 genome sequences: • Assess sequence variation by counting the number of phylogenetically-informative sites: • Little variation: 5 WG • Detectable variation in first 5 WG: obtain 10 WG • 459.5 individual, PCR-amplified viral genomes were directly sequenced
Time between the last immunization and HIV-1 infection Number of immunizations at the time of infection * 3 Vaccine recipient who ended up completing 2 immunizations Vaccine recipient who ended up completing 3 immunizations Placebo recipient who ended up completing 2 immunizations Placebo recipient who ended up completing 3 immunizations 2 * 1 Days since last immunization • Samples were collected at the same time after the last immunization for Vaccine (156 days) and Placebo (163 days) recipients • The 68 plasma samples from which WG were obtained corresponded to the : • First HIV-1 positive samples for 66 volunteers: 39 Vaccine, 27 Placebo • Second HIV-1 positive samples for 2 volunteers*: 1 Vaccine (d.364), 1 Placebo (d.247)
Number of Founder Viruses Detected 49 subjects 16 subjects Vaccine Placebo Phylogenetically-informative sites 74 3 1 2* 4 Number of founder variants • 49/65 = 75% of subjects replicating a single variant • 16/65 = 25% of subjects replicating multiple variants • Among vaccinees: 10/40 = 25% of subjects replicating multiple variants • Among placebos: 6/25 = 24% of subjects replicating multiple variants • Insufficient data from 3 individuals
Linked transmission pair NYC 502-0309 26 October 06 NYC 502-0879 22 March 07 CRF02-AG HXB2 STEP vaccine Are there phylogenetic clusters consistent with transmission between trial participants? Vaccine Placebo Yellow highlighting indicates multiple variants from one subject nef
NYC Toronto Rochester Linked transmission pair NYC NYC 502-0309 26 October 06 NYC 502-0879 22 March 07 CRF02-AG San Francisco HXB2 Seattle St. Louis STEP vaccine Lima Iquitos Lima Seattle Lima Iquitos Lima Lima Lima Los Angeles Boston Los Angeles NYC Atlanta NYC Miami Miami Toronto NYC Birmingham Denver Atlanta NYC NYC Seattle Lima Denver Miami Lima NYC Denver Iquitos Iquitos Lima Seattle St. Louis NYC Denver Atlanta Denver San Francisco Toronto NYC Vaccine St. Louis NYC San Francisco Placebo San Francisco Houston Atlanta Yellow highlighting indicates multiple variants from one subject NYC nef NYC Birmingham San Francisco Houston NYC Atlanta NYC
Overall, are breakthrough/founder viruses unusually divergent from the vaccine? (No) Distances from breakthrough sequences to STEP vaccine sequence were calculated using an HIV-specific model of protein evolution* p=0.3331 p=0.3275 p=0.3766 Nef Gag Pol *Nickle D, Heath L, Jensen M, Gilbert P, Mullins J, Pond S. 2007. HIV-specific probabilistic models of protein evolution. PLoS ONE, June 6; 2:e503.
Summary - 1 • Phylogenetic analysis of breakthrough viruses from 66 trial volunteers • Single HIV-1 variants established infection in 75% of volunteers • One cluster with 2 HIV-1 infected individuals • 2 vaccine recipients from NYC • All subtype B infections except one CRF02-AG • No difference between Placebo and Vaccine in the genetic distances from the breakthrough to the STEP vaccine sequences
CTL-mediated selection for breakthrough viruses? *Epipred. Listgartner, Cadie, Heckerman, Journal of Computational Biology 2007. available at: http://atom.research.microsoft.com/bio/epipred.aspx Methods • Known and potential CTL epitopes were predicted using Epipred* (with a posterior probability > 0.80). • Epitopes were predicted based on each volunteer’s HLA type in: • Breakthrough viral sequences (WG) • STEP vaccine sequence (Gag, Pol, Nef) • Viral sequences from 3 individuals were excluded: • One female individual: 502.1115 (Placebo) • CRF02_AG isolate: 502.2696 (Vaccine) • No HLA genotype data was available from 1 placebo recipient: 502.1504 • Epitope prediction on: • 64 WG (39 vaccine recipients; 25 placebo recipients) • 2 partial sequences from 2 placebo recipients
Breakthrough vs. Vaccine: Predicted Epitopes Only Number of epitopes 13 12 Placebo Vaccine n = 26 n = 39 • Gag + Pol + Nef: ~1700 AA • Predicted epitopes: ~120 AA Analysis on predicted epitopes is restricted to ~7% of the Gag-Pol-Nef sequence data
Breakthrough vs. Vaccine: Predicted Epitopes Only • Protein distances between the breakthrough and the STEP vaccine epitopes were calculated using an empirical HIV-specific model of protein evolution • Epitope-specific distances were summarized to obtain one ‘breakthrough to STEPvax’ distance value per subject p =0.0232 Distance 0.030 0.011 Placebo Vaccine n = 26 n = 39 Viruses infecting vaccinees were more likely to have epitopes that differed from those in the vaccine
Breakthrough vs. Vaccine: Predicted Epitopes Only Gag Pol Nef p =0.1465 p =0.8299 p =0.0298 Distance 0.064 0.028 0.021 0.011 0.008 0.008 Placebo Vaccine n = 25 n = 37 Placebo Vaccine n = 26 n = 36 Placebo Vaccine n = 26 n = 38 • Viruses infecting vaccinees were more likely to have epitopes that differed from those in the vaccine • The effect is primarily driven by mutations seen in Nef epitopes
Summary - 2 Analysis of predicted epitopes • Viruses infecting vaccinees were more likely to have epitopes that differed from those in the vaccine • These data indicate that the vaccine may have blocked establishment of infection by those variants sharing more epitopes with the vaccine • Whether vaccine-induced CTL-mediated pressure drives subsequent viral evolution requires sequences from later time-points
Context of Sieve Analysis: Challenged Statistical Power • Achieving high statistical power requires: • Large n of infected subjects with sequence data • A vaccine that induces immune responses that ‘react strongly’ with the infecting viruses • For Step, the sieve analysis has relatively low power • Small number of infections (n=66) • Phase 2b, not Phase 3 (VaxGen: n=336) • At an epitope level, the vaccine appeared to induce limited potential selective pressure • On average, a vaccinee recognizes < 1 reactive epitope in an average exposing HIV • Can only detect relatively large sieve effects
Structure of Sieve Analysis • Assess Gag, Nef, Pol, Env separately • Assess either 1 sequence per subject (majority consensus) or use all individual sequences • Compare a subject’s sequences to the StepVx sequence in 2 ways: • Global: Summarize overall ‘similarity’ or ‘distance’ with a single number • Local: Evaluate each site and sets of sites separately (i.e., ‘antigen scanning’, machine learning classification)
Summary Measure Sieve Analysis • Compute similarity or distance measures v between the StepVxsequence and a subject’s set of sequences • For simple and valid statistical tests, use one number per infected subject • Wilcoxon tests of whether the distributions of summary measures differ between infected vaccine vs infected placebo
Summary Measure Sieve Analysis • Epitope-based summary measures: Compare known and predicted T cell epitope sequences (8-mers through 11-mers) in StepVx sequence to a subject’s corresponding sequences E.g., StepVx-sequence 9-mer Gag 77-85: A subject’s sequences: • These results focus on simplest measure that scores 0 or 1 for match or mismatch GAG SLYNTVATL Con . . F . . . . V . Seq . . . . . . . V . Seq . . . . . . . V . Seq . . F . . . . V . Seq . . F . . . . V .
Summary Measures Used for These Analyses (Based on Shared Epitopes) • ‘Absolute’ Similarity Score:Number epitopes in both the StepVx sequence and in all of a subject’s sequences • ‘Percent’ Similarity Score: Percent of epitopes in the StepVx sequence that are also in all of a subject’s sequences Estimate in 2 ways, based on all of a subject’s HLA alleles: • Known & Highly Likely Epitopes: Restrict to all 8-mers through 11-mers in the StepVx sequence that are known epitopes or predicted epitopes with probability > 0.80 of being an epitope (from Epipred*) • All Possible Epitopes: Consider all 8-mers through 11-mers in the StepVx sequence with positive probability of being an epitope *Heckerman D, Kadie C, Listgarten J (2007). Leveraging information across HLA alleles/ supertypes improves epitope prediction. J Computational Biology 14:736-746.
Translation of Percent Similarity Score to Percent Mismatch Distance • Percent Similarity Score: Percent of epitopes in the StepVx sequence that are also in allbreakthrough sequences • We report results using the equivalent Percent Mismatch Distance = 1 - Percent Similarity Score Percent Mismatch Distance = Estimated percent of epitopes in the StepVx sequence that are not in any of the subject’s sequences
Estimated Number Shared Epitopes (Known & Highly Likely) p=.46 p=.91 p=.24
Estimated Number Shared Epitopes (Account for all 8-11 Mers) p=.07 p=.19 p=.04
Percent Mismatched Epitopes (Known & Highly Likely) p=.16 p=.32 p=.09
Percent Mismatched Epitopes (Account for all 8-11-mers) p=.09 p=.46 p=.06
More Sophisticated Epitope-Based Summary Measures (Ongoing Analyses) • Similar to the above except account for biological knowledge of HIV evolution and MHC-peptide interactions • Weight AA positions by • Entropy • Whether a primary or secondary anchor site • Weight distances between K-mer peptides by • Predicted change in binding energy • Evolutionary cost of AA mismatches* *Nickle D, Heath L, Jensen M, Gilbert P, Mullins J, Pond S (2007). HIV-specific probabilistic models of protein evolution. PLoS ONE, June 6; 2:e503. GAG SLYNTVATL Con . . F . . . . V . Seq . . . . . . . V . Seq . . . . . . . V . Seq . . F . . . . V . Seq . . F . . . . V . (The results Morgane reported use this weighting) Thanks to Tomer Hertz for discussions about defining peptide-distances
Evolutionary-Cost Weighted Epitope Distances (Shown Earlier) p =0.1465 p =0.8299 p =0.0298 Distance 0.064 0.028 0.021 0.011 0.008 0.008 Placebo Vaccine n = 25 n = 37 Placebo Vaccine n = 26 n = 36 Placebo Vaccine n = 26 n = 38 Gag Pol Nef
The analyses shown did not account for the timing of sequencing relative to the development of immune responsesBased on knowledge of early HIV infection dynamics, a vaccine selective effect may be expected to be restricted to (or stronger on) early viruses Break down results by whether sequences were measured pre-seroconversion (n=27 infected subjects)
Estimated Number Shared Epitopes (Known & Highly Likely) Interaction p-values: p=.09 p=.43 p=.002 P-values for Ab-: p=.05 p=.64 p=.002
Percent Mismatched Epitopes (Known & Highly Likely) Interaction p-values: p=.81 p=.90 p=.01 P-values for Ab-: p=.20 p=.43 p=.0009
Summary of Global Sieve Analysis of Epitope-Based Summary Measures • Pol:No statistical evidence of sieving • Gag:Weak/borderline statistical evidence of sieving (overall p-values .07, .09, .15, .16, .46) • Timing analysis tentatively supports sieve effect may be concentrated on pre-seroconversion viruses • Nef:Fairly strong statistical evidence of sieving (overall p-values .03, .04, .06, .09, .24) • Timing analysis supports sieve effect concentrated on pre-seroconversion viruses • Interaction p-values .002, .01, .08, .13 • Pre-seroconversion subgroup p-values .0009, .002, .01, .01
Antigen Scanning of AA Sites • Test each AA site as a signature site: • Signature site = a site where the frequency of AA mismatches to the StepVx AA differs in vaccine vs placebo sequences • 2 analyses: • 1 sequence per subject (majority consensus variant)* • All individual sequences** • Use adjusted p-values, q-values to guard against false positives Vx reference sequence Vaccinee breakthrough sequences Placebo breakthrough sequences *Method of Gilbert, Wu, Jobes (2008, Biometrics) **Nonparametric bootstrap pairwise mismatch method
Machine Learning Methods to Classify Sequences by Vaccine/Placebo • Classify vaccine/placebo status from AA characters at sets of AA sites • Use all individual sequences • Cross-validation (at subject level) to estimate classification accuracy on hold-out data • Inductive learning methods: • Divide and conquer algorithms (decision trees) • Induction rules • Ensemble models (boosting, bagging, bumping)
Results: AA Site Scanning *Known CTL epitope escape site Bonferroni adjustment: Gag 84: adjusted p < .01 (majority consensus scanning) and adjusted p = .015 (all sequences scanning) Pol 541: adjusted p = .024 (all sequences scanning)
Machine Learning Results: Certain Sets of AAs Classify Vaccine/Placebo Status Better Than Chance • Correct classification rate of vaccine/placebo status on hold-out data: • Gag: ~78% • Nef: ~ 68% • Pol: ~ 64% Benchmark: random guessing gives rate of 60% Best classifying sets of AA sites • Gag 84V, 124N, 406R • 77% vaccinee sequences; 0% placebo sequences • 84 (SLYNTVATL) A*0201 A*0202 A*0205 + several other epitopes • 124 (NSSKVSQNY) B*3501 • 406 (CRAPRKKGC) B14 • Nef 116N, 120Y • 56% vaccinee sequences; 2% placebo sequences • 116 (HTQGYFPDW) B57 • 120 (YFPDWQNYT) A29 B*3701 B*5701 Cw6
In several A-list epitopes including position 8 in SLYNTVATL A*0201 A*0202 A*0205 LANL B (N=324): 65% T 34% V
Position 9 of ETINEEAAEW A*2501 LANL B (N=324): 93% E 6% D
Elite-controller protective epitope (Walker and colleagues) Position 1 of HTQGYFPDW B57 LANL B (N=824): 84% H 14% N
Prior to infection, did the breakthrough vaccinees react with epitopes containing these signature sites?
Week 8 ELISpot Reactions with StepVx Sequence 15-mers (N=37 Vaccinees)
Vaccinee T Cell Reactions to Vaccine 15-Mers Containing Signature Sites (N=37) • Of N=37 infected vaccinees evaluated, 4 had a positive ELISpot response to an epitope including a signature site • Gag 84 Signature: 1 vaccinee (A*0211) had a positive response to Gag SLYNTVATLYCVHQK 2 vaccinees (A*1101) had a positive response to Gag SLYNTVATLYCVHQK • Pol 721 Signature: 1 vaccinee had a positive response to Pol GIRKVLFLDGIDKAQ and to Pol DGIDKAQDEHEKYHS • All Other Signatures: No Vaccinee Reactions 84 84 721 721
GAG SLYNTVATLYCVHQK Con . . F . . . . V . . . . . . . Seq . . F . . . . V . . . . . . . Seq . . F . . . . V . . . . . . . Seq . . F . . . . V . . . . . . . Seq . . F . . . . V . . . . . . . Seq . . F . . . . V . . . . . . . Breakthrough Sequences for 3 Vaccinees With a Reaction to SLYNTVATLYCVHQK GAG SLYNTVATLYCVHQK Con . . . . . . . V . . . . . . R Seq . . . . . . . V . . . . . . R Seq . . . . . . . V . . . . . . R Seq . . . . . . . V . . . . . . R Seq . . . . . . . V . . . . . . R Seq . . . . . . . V . . . . . . R Seq . . . . . . . V . . . . . . R Seq . . . . . . . V . . . . . . R Seq . . . . . . . V . . . . . . R Seq . . . . . . . V . . . . . . R Seq . . . . . . . V . . . . . . R Seq . . . . . . . V . . . . . . R Reacting Vaccinee 3 A0211 A02G1 B1504 B1504 C0101 C0102 Reacting Vaccinee 1 A0101 A1101 B0801 B35G1 C04G1 G07G1 GAG SLYNTVATLYCVHQK Con . . F . . . . V . . . . . . . Seq . . F . . . . V . . . . . . . Seq . . F . . . . V . . . . . . . Seq . . F . . . . V . . . . . . . Seq . . F . . . . V . . . . . . . Seq . . F . . . . V . . . . . . . Seq . . F . . . . V . . . . . . . Seq . . F . . . . V . . . . . . . Seq . . F . . . . V . . . . . . . Seq . . F . . . . V . . . . . . . Seq . . F . . . . V . . . . . . . Seq . . F . . . . V . . . . . . . Reacting Vaccinee 2 A1101 A3101 B3503 B51G1 C04G1 C1502