Download
1 / 27
270 likes | 438 Views
Sea Level Rise. ?. Bert Vermeersen. New Scientist No. 2 July 2013. “ High & Dry When extra warming of the Earth implies that sea level drops “. Introductory Statement.

E N D
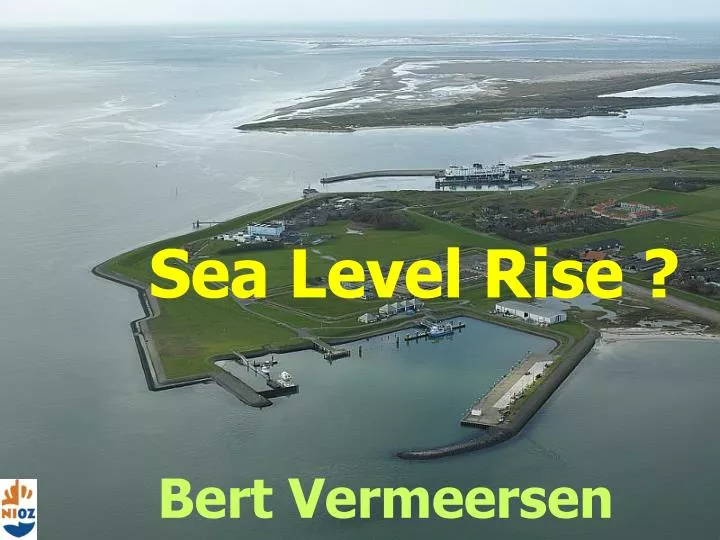
Sea Level Rise ? Bert Vermeersen
New Scientist No. 2 July 2013 “ High & Dry When extra warming of the Earth implies that sea level drops “
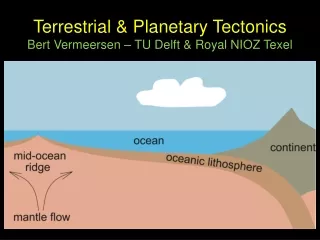
Introductory Statement • Relative sea level variations due to continental ice mass changes has never been uniform, is not uniform today, and will never be uniform due to accompanying • gravity changes • solid-earth deformation, and • induced changes in Earth rotation (polar wander)
JASON-1 TOPEX/POSEIDON Satellite Altimetry Observing Sea Level Change from Space
Sea Level Change Observed by Satellite Altimetry … (Courtesy: Steve Nerem)
… as Derived from Spatially Highly Variable Ups and Downs … 3.1 ± 0.4 (Courtesy: Steve Nerem)
Sea level change is observed to have been highly non-uniform over the world’s oceans over the past 19 years regionally varying between -1.5 cm and +1.5 cm per year
If a point-like ice sheet of mass MI forms, then the eustatic sea-level fall is simply: with Aw the ocean surface area and ρw the density of the water or ice. With changes of gravitation taken into account the sea-level change becomes (equipotential surface !!!): with ME the mass of the Earth with density ρE and with the last term the eustatic sea-level drop. Effect of Gravitation on Sea Level Change r R θ
Effect of Self-gravitation on Sea-Level 2,200 km 6,700 km Meltwater distributes as an inverse sine function over the world’s oceans
Sea level change due to land ice melt is thus never uniform over the world’s oceans due to accompanied changes in the gravity field. • Irrespective of the amount of ice melt, sea level due to ice melt • drops within a radius of 2200 km of land ice melt; • rises with amounts less than the uniformly average value for radial distances between 2200 and 6700 km away from the melting land ice; • rises with amounts larger than the uniformly average value for radial distances from the melting land ice exceeding 6700 km. • Examples: • if the complete Greenland ice sheet would disintegrate, sea level thus would not rise by the average value of 7 m at Dutch coasts, but by about 2 m; • melt of Icelandic glaciers would produce a slight sea-level drop in The Netherlands; • Antarctic ice melt induces slightly larger than average (eustatic) values of sea level rise at Dutch coasts, though! • (from: L.L.A. Vermeersen & R. Sabadini: Polar Wander, Sea Level Variations and Ice Age Cycles, Surveys in Geophys., Vol. 20, p. 415 - 440, 1999)
James Croll (1821 – 1890) 1867 - 1880: secretary & accountant of the Scottish Geological Survey in Edinburgh
Mass Changes Induce Polar Wander (“Poolvlucht”) The rotation pole of the Earth wanders over its surface with velocities of about 10 cm per year
Scenario of ice melt from Greenland for a non-rotating elastic Earth
Scenario of ice melt from Greenland for a rotating elastic Earth
Scenario of WAIS collapse for a rotating elastic Earth J.L. Bamber, R.E.M. Riva, L.L.A. Vermeersen & A.M. LeBrocq, Reassessment of the Potential Sea-Level Rise from a Collapse of the West Antarctic Ice Sheet, Science, 324, 901-903, 2009
125.000 years BP 22.000 years BP Today Postglacial Rebound Following an Ice Age (Kaufmann, 2004)
Total Ice Mass Decay History of the Last One Viscoelastic Earth Model with a Maxwell Mantle Rheology
Sea Level Change Since Last Glacial Maximum Present-Day Sea Level Change Due to Post-glacial Rebound
Long-Term Relative Sea Level Change Ingredients ice mass changes of Greenland, Antarctica & mountain glaciers thermal expansion, salinity changes & changes in ocean currents continental water changes influence of deformation, gravitation & rotation if mass changes are occurring (also for e.g. non-thermal ocean currents changes!) postglacial rebound incorporating regional solid-earth structures and non-linear rheologies (present models account only for laterally homogeneous earth models and linear solid-earth Maxwell rheologies) regional and local sea floor vertical displacements local subsidence due to exploitation of natural resources sediment transport …… ?
Scenario’s sea level rise Netherlands (KNMI) for 2050 compared to average value 1976-2005 +15 tot +35 cm in 60 years (2050 – 1990) www.getij.nl HW HW Height w.r.t. NAP (cm) Den Helder June 08 2011 LW 06:10 -89 cm HW 12:44 +71 cm LW 19:31 -84 cm HW 23:20 +22 cm LW LW Time of the day (hours)
Integrated Monitoring Networks: 2 Initiatives WaLTER (Wadden Sea Long-Term Ecosystem Research) Setting up an integrated monitoring network to address overarching questions in the Wadden Sea, including consequences of sea level rise for ecology and economy [www.walterproject.nl] PACE Understanding, quantifying and predicting processes driving sediment transport in the Wadden Sea and its susceptibility to climate change, using coastal ocean numerical models [www.nioz.nl/pace]
Conclusions Relative sea level change is highly non-uniform over the world’s oceans and seas whenever this is due to mass variations (e.g. land ice melt, post-glacial rebound) Regional projections for relative sea level change of the Wadden Sea are necessary as these might differ substantially from globally averaged projections There are many potential contributors, are all identified? Regional relative sea level variation model projections and their interactions with sediment transport have to be accompanied by integrated monitoring networks for continuous validation Two monitoring network initiatives for the Wadden Sea have recently started: WaLTER and PACE