Download
1 / 9
90 likes | 229 Views
Characterization of quantum dot chains using transmission electron microscopy. Tyler Park Jeffrey Farrer John Colton Haeyeon Yang. APS March Meeting 2012, Boston. * Special thanks Felipe Rivera and Thomas McConkie for sample preparation (FIB/SEM). Introduction.

E N D
Characterization of quantum dot chains using transmission electron microscopy Tyler Park Jeffrey Farrer John Colton Haeyeon Yang APS March Meeting 2012, Boston * Special thanks Felipe Rivera and Thomas McConkie for sample preparation (FIB/SEM)
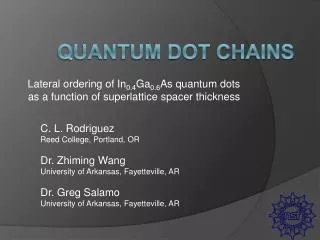
Introduction • What are quantum dot “chains?” • What is their significance? • Optoelectronic Devices • Conduit for spin information W. V. Schoenfeld et al., Appl. Phys. Lett. (1999) (110) Dong Jun Kim and Haeyon Yang, Nanotechnology,(2008). Zh. M. Wang, et al., Journal of Applied Physics, (2006).
Previous work • Stranski-Krastanov (1939) • Prepatterned SubstratesLee et al., Nanotechnology, (2006) • Strain driven self-assemblyM. Riotte et al., Applied Physics Letters, (2004) InGaAs
Our samples • Grown at lower temperature so quantum dots don’t form yet • Annealing process, during which dots are formed • More control on growth A.O. Kosogov et al., Appl. Phys. Lett. (1996) • 3 samples with slightly different growth parameters InGaAs
Our Samples - methods • Photoluminescence (PL) spectroscopy • Time-resolved PL • Transmission electron microscopy (TEM) • Chains with GaAs cap* • Chemical analysis • Partial electron energy-loss spectroscopy (PEELS) • X-ray energy dispersive spectroscopy (XEDS) *Zh. M. Wang et al., Journ. Of App. Phys. (2006)
Sample preparation • Focused Ion Beam (FIB) • Cross-section cuts • Lift-out method • Plan view cuts • Our own method?
Issues • Contamination • Damage from silicon sample holder • Cross-section cuts • Difficult to see an individual dot • Plan view cuts • Quantum dots are close to surface • Thinning issues • Platinum deposits
Current results • Images • Chemical Analysis: • 032607B (EDS) 032607B 032607B GaAs cap GaAs cap InGaAs layer InGaAs layer GaAs bulk GaAs bulk 032607A
summary • The quantum dots seen, but not individually • Chemical analysis is so far close to what we were expecting • Continue with chemical analysis on cross-section cuts • Find a practical way of obtaining a plan view cut • Future work: Spin information transmission?