Download
1 / 25
250 likes | 508 Views
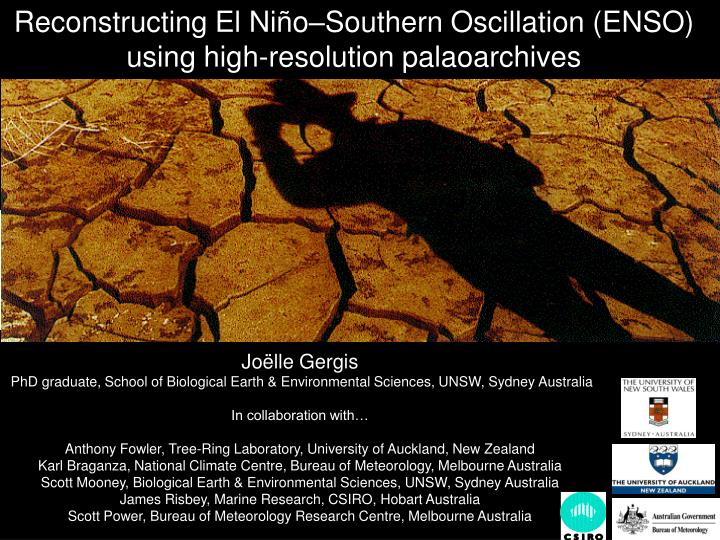
Reconstructing El Ni ñ o – Southern Oscillation (ENSO) using high-resolution palaoarchives. Jo ë lle Gergis PhD graduate, School of Biological Earth & Environmental Sciences, U NSW, Sydney Australia In collaboration with…

E N D
Reconstructing El Niño–Southern Oscillation (ENSO) using high-resolution palaoarchives Joëlle Gergis PhD graduate, School of Biological Earth & Environmental Sciences, UNSW, Sydney Australia In collaboration with… Anthony Fowler, Tree-Ring Laboratory, University of Auckland, New Zealand Karl Braganza, National Climate Centre, Bureau of Meteorology, Melbourne Australia Scott Mooney, Biological Earth & Environmental Sciences, UNSW, Sydney Australia James Risbey, Marine Research, CSIRO,Hobart Australia Scott Power, Bureau of Meteorology Research Centre, Melbourne Australia
Why Study El Niño-Southern Oscillation (ENSO) ? • Largest source of inter-annual climate variability – affects 60% of the planet • Modulates high-impact climate extremes: droughts, floods, cyclones, bushfires
What was ENSO like in the past ? • Relatively limited understanding of pre-observational ENSO • How have the frequency and magnitude of ENSO event cycles changed? • What were the societal impacts of past ENSO events? • Use past ENSO behaviour to help refine predictive capability of GCMs • Current IPCC models do not simulate ENSO very well • It is still unclear how ENSO will respond to an increasingly warm world
Research Objectives Aim: to assess how unusual recent ENSO variability has been in the context of the past five centuries • Review the use of observational ENSO indices used forproxy calibration/reconstruction 2. Capturing regional ENSO signals from proxy records: West Pacific example: NZ Kauri tree-ring record • ENSO reconstructions results (A.D. 1525-2002) using tree-ring, coral, ice & documentary records • Discrete event analysis (Quinn, Ortlieb) • EOF analysis (Mann, Stahle, D’Arrigo)
Defining instrumental ENSO for palaeoclimatic studies Event DEFINITION critical for proxy calibration/ transfer function development • TWO components of the ENSO system: • Atmosphere pressure (Southern Oscillation) • Ocean temperature (Niño Region SSTs) • Differences in ENSO event signatures and El Niño/ La Niña phase transitions • - Nov 2007: east Pacific SST cooling, relatively minor western Pacific signal, SOI only weakly positive
Instrumental Records of ENSO: SSTs & SOI Event capture comparison; Hanley et al. (2003),Journal of Climate 16:1249-1258 • SOI has lower La Niña event capture than most SSTs • “Classic” South American El Niño region 1+2: notably poor (lowest) event capture • Niño 3 good El Niño sensitivity, but La Niña sensitivity lower than other SST indices • West Pacific SSTs (Niño 3.4 and Niño 4) most El Niño sensitive • Niño 3.4 best event capture of BOTH phases (Niño 4 less La Niña sensitivity)
Instrumental ENSO Classification Issues - Little widespread consensus on the definition of ENSO- issue is non-trivial - Atmospheric & oceanic components can be out of phase (‘decoupled’) & magnitude of event anomalies differ - Limited attempts to combine oceanic& atmospheric indices for palaeoclimate applications
50% extreme events (CEI = +/- 3) post-1970 Coupled ENSO Index (CEI) - Simultaneously indicates ocean (Niño 3.4 region SSTs) & atmospheric (SOI) anomalies - SOI+ SST combined so anomalies indicated by each component index are preserved - Coupled (synchronous) events indicated by amplification of magnitude - New composite index: BOTHENSO components maintained > amplitude preserving calibration - Common basis for comparison of proxy records (Gergis and Fowler (2005), International Journal of Climatology, 25:1541–1565)
High-resolution ENSO proxy records • Instrumental records too SHORT to resolve decadal-centennial ENSO variability • High resolution proxies record seasonal and annual climate variability • Complementary aspect of ENSO e.g; marine vs. terrestrial, tropics vs. mid-latitudes • Relatively limited Southern Hemisphere and Western Pacific coverage
Pre-2003 update, no post-1980 data from Northland… Period of high ENSO activity 175E 37S Auckland Western Pacific ENSO proxy: New Zealand Kauri tree-ring record • 17 modern sites (living trees) • 11 sub-fossil sites (swamp material)
New Zealand Kauri tree-ring record • NZ Kauri record now longest tree-ring record in the Western Pacific: 3,726 yrs continuous • Calendar dated 1724 B.C. - A.D.2002 • Long-lived species rare; only handful of “ENSO sensitive” tree-ring records available globally • Provides long-term history of ENSO from Western Pacific • Important counterpart to East Pacific tree-ring records from SW USA & Mexico e.g Stahle et al. (1998), D’Arrigo et al. (2005)
Kauri response to ENSO indices • Kauri shows good statistical relationships with ENSO indices: correlations ~0.6 over the 1950-2002 period • (Fowler et al. (2007) International Journal of Climatology, in press) • - Peak sensitivity of SON and DJF (peak maturity of ENSO) • Stronger relationship with (western pole) SOI • Correlations with CEI stronger than any of the component indices
Reconstructing the CEI using Kauri tree-rings Spring (SON) CEI regressed using kauri tree-rings (r= 0.45, 1871-2002) • - Every proxy IMPERFECT: <50% instrumental variance common • - Regional signals only a PART of the large-scale ENSO signal • Complicated by which ENSO index used for calibration (SOI, SSTs, CEI ??) • Differences in phase sensitivity e.g. Kauri has a stronger El Niño signal
Kauri master chronology (A.D. 1550–2002) • - Distinct 50–70 year cycle evident in 31-yr moving variance • Baseline shift in variance around 1870 (end of “Little Ice Age”)& the start of large-scale (global) industrialisation • Late C20th appears unusual (5 widest rings occur post 1982)
Multiproxy approaches to ENSO reconstruction Tree-rings Coral Ice Core Documentary/Rainfall - Single proxy analysis limited: each record has unique REGIONAL event signature; - MULTIPLE records allows us to look at GLOBAL patterns of ENSO variability - Large-scale spatial patterns & event magnitudes (Gergis et al., 2006) Dec 1997-98 SST anomalies NCEP/Reynolds SST analysis N.B selection based on published ENSO sensitivity & continuous record length
Records assessed by “hits and misses” against instrumental record (CEI, each season) => ‘proxy skill’ • Percentile analysis= no loss of variance, outliers usually excluded from regression maintained • Calibration shows differences in phase-sensitivity: 2 separate reconstructions based on proxy subsets • Tree-ring records best overall performers (replication => exact dating), uncertainties in coral dating?? Reconstructing Discrete ENSO events (Gergis & Fowler, 2006; Gergis & Fowler, Climatic Change in review)
ENSO Event lists Notable phase sensitivities at single and multiple proxy level. 92 El Niño & 82 La Niña events reconstructed since A.D. 1525 • This study is the 1st to use extensive East &West Pacific ENSO proxies • Range of (quantified) event magnitudes • Reconstruction quality assessed • Most comprehensive La Niña event list compiled to date • Considerably expands existing historical El Niño chronologies (South American Quinn records) Gergis & Fowler, 2006; Gergis & Fowler, Climatic Change in review
Quality-adjusted Magnitude (MQ) time-series; takes replication and proxy skill into account • - Five percentile based magnitude classes calculated for each phase (outliers maintained rather than truncated using regression) Decadal trends in ENSO event magnitude • C16th -17th; overall reduction in ENSO activity : during the Little Ice Age • C18th -19th; 65% of events classed as weak-moderate • C20th; 43% of all extreme events, 30% of total extreme event years are post-1940
Empirical Orthogonal Function (EOF) analysis used to decompose proxy data into leading modes of co-variability based on current (t), lead (t-1) and lag (t+1) relationships • Best results with CEI: DJF (t=0) r = -0.72 and SON (t+1) r = -0.67 • 53% of C20th DJF CEI variance: 48% of DJF SOI and 49% MAM Nino 3.4 SSTs • Peak maturity of ENSO conditions best captured by coupled anomalies retained in CEI • Monte Carlo synthetic data testing used for verification Reconstructing ENSO indices using EOF analysis
Spectral correspondence over the instrumental period Braganza et al., Climate Dynamics in review • Power spectrum for instrumental DJF CEI reconstructions for the period 1871-1982. • Reconstructions reproducing frequencies in ‘classical’ 2-7 year ENSO band • Significance at the 90% and 95 % (dotted lines) level is indicated relative to estimated background AR1 noise, effective bandwidth after smoothing = 2.66/N cycles/year.
Past ENSO amplitude and frequency modulation Hovmoller of the 50 year moving (window) power spectrum for R5 for 1525-1982. Effective bandwidth after smoothing = 2.66/N cycles/year. Evidence of increased high frequency variability over the past 2 centuries
Low frequency: Inter-decadal Pacific Oscillation (IPO) The IPO is the Southern Hemisphere equivalent of the PDO Proxy-ENSO indices R5 and R8 are shown with the low frequency component of the SOI (Braganza et al., Climate Dynamics, in review).
Complementary applications of ENSO reconstructions - Event chronologies used for pre-instrumental verification/cross-validation - Stahle, Rodbell, Mann etc use “Quinn” chronologies from South America to define ENSO event ‘reference’ years NB: Quinn record is a documentary record of ONE (East Pacific) region’s impact of El Niño events…West Pacific & La Niña NOT considered Source: Mann et al. (2000)
Summary 1) Multi-proxy reconstructions of ENSO still in its infancy…encouraging results but there are many opportunities for resolving more information on past ENSO behaviour 2) Further research needed to examine regional synoptic features, propagation characteristics, regional stationarities, event probabilities etc…complementary techniques needed to target specific issues and overcome biases in each method 3) Proxy reconstruction potential is maximised by using a calibration index that accounts for both ocean and atmosphere components of ENSO 4) Greatest skill in reproducing observed climate variability was found using the Coupled ENSO Index (CEI) reconstructions particularly for the December-May period: up to 53% variability reproduced; higher than skill published by Mann, Stahle, D’Arrigo… 5) Considerable improvements in ENSO reconstruction are achieved from expanding the representation of records from the western Pacific 6) Late C20th century high-frequency ENSO appears anomalous in the context of the past 5 centuries; it is likely that ENSO operates differently under pre and post-industrial background states: modeling studies required to assess ENSO forcings 7) ENSO is the dominant source of the Earth’s inter-annual climate variability, improving our understanding of past ENSO is critical for determining future predictability needed to mitigate the socio-economic impacts of future ENSO events
Acknowledgements Many thanks to: NOAA &the International Pacific Research Center (IPRC) for financial assistance to participate in the workshop. Tree-ring Laboratory, University of Auckland, New Zealand; Anthony Fowler, Gretel Boswijk, Drew Lorrey, Jonathan Palmer, Peter Crossley ad Jenny Lux. NZ Department of Conservation, Panguru Development Trust, Te Iwi o Te Rarawaand Te Iwi O Te Roroa communities (Northland NZ). Penny Whetton (CSIRO) and Ian Rutherfurd (University of Melbourne) for historical ENSO data: Nile Flood Record, Berlage Teak Chronology, North China Rainfall data. Erica Hendy (Lamont Doherty Earth Observatory) for Great Barrier Reef coral luminescence master record. Pavla Fenwick (Lincoln University, New Zealand) for Pink Pine tree-ring data, South Island, NZ. Bruce Bauer (NOAA’s World Data Center for Paleoclimatology/National Climatic Data Center. Paleoclimatology Branch)for data acquisition and assistance. Karl Braganza thanks Scott Power, Matthew Wheeler & Harry Hendon (BMRC) for statistical advice.


![El Niño Southern Oscillation [ENSO]](https://cdn1.slideserve.com/1597810/el-ni-o-southern-oscillation-enso-dt.jpg)