Download
1 / 34
340 likes | 441 Views
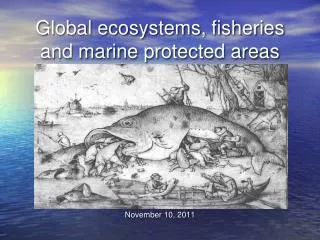
Global overview of marine fisheries by S.M. Garcia and I. De Leiva Moreno (FAO Fisheries Department). Prepared for the Reykjavic Conference on Responsible Fisheries in the Marine Ecosystem, 1-4 October 2001.

E N D
Global overview of marine fisheriesby S.M. Garciaand I. De Leiva Moreno(FAO Fisheries Department) Prepared for the Reykjavic Conference on Responsible Fisheries in the Marine Ecosystem, 1-4 October 2001
Global overview of marine fisheriesby S.M. Garciaand I. De Leiva Moreno(FAO Fisheries Department) Where do we stand ? Prepared for the Reykjavic Conference on Responsible Fisheries in the Marine Ecosystem, 1-4 October 2001
Outline • The State of the Resources: • The Fishing Industry: • The Governance Approaches: • Conclusions
1. The State of the Resources • Global Situation • Global trends • Regional perspective
Recovering The state of stocks in 1999 Depleted Overexploited Fully exploited Moderately exploited Undeveloped 0% 10% 20% 30% 40% 50%
Upper limit ( FAO, 1971) Global trend in landings 100 EEZs Claims million tonnes) 50 Production ( 1800 1840 1880 1920 1960 2000 Year
Trends in state of stocks 60% Fully Fished 50% 40% Moderately fished: U+M 30% 20% Overfished: O+D+R 10% 0% 1970 1975 1980 1985 1990 1995 2000 2005
Phase IV - Senescent Development phases: World 100% 90% 80% 70% Phase III - 60% Mature Percentageofresources 50% 40% Phase II - Developing 30% 20% Phase I - 10% Undeveloped 0% 1951 1953 1955 1957 1959 1961 1963 1965 1967 1969 1971 1973 1975 1977 1979 1981 1983 1985 1987 1989 1991 1993
Ratio between present and historical landings 1 . Antarctic 0.14 ANT 2. Atlantic, Southeast 0.39 ASE 3. Pacific, Southeast 0.43 PSE 4. Atlantic, Northwest 0.44 ANW 5. Atlantic, Western Central 0.71 ACW 6. Pacific, Eastern Central 0.73 PEC 7. Med it . & Black Sea 0.81 MBS 8. Pacific, Northeast 0.83 PNE 9. Atlantic Southwest 0.86 ASW 10. Atlantic Eastern Central 0.87 AEC 11. Atlantic Northeast ANE 0.92 12. Indian Western 0.94 IW 13. Pacific Central Western 14. Pacific Southwest PCW 1.00 15. Pacific Northwest PSW 1.00 16. Indian Eastern PNW 1.00 1.00 IE 0.0 0.1 0.2 0.3 0.4 0.5 0.6 0.7 0.8 0.9 1.0
North Pacific North Atlantic % of Stocks Exploited Beyond MSY 50% 40% 30% 20% 10% 0% 1970 1975 1980 1985 1990 1995 2000 2005
Antarctic Tropical Atlantic Tropical Pacific % of Stocks Exploited Beyond MSY 60% 50% 40% 30% 20% 10% 0% 1970 1975 1980 1985 1990 1995 2000 2005
State of ICES Stocks: 1970-1998 0% Good 1976 20% Buffer 40% 60% Bad 80% 80% 100% 1982 1998 1978 1986 1990 1994 1970 1974
2. The Fishing Industry • The fishing fleet • The fishers • The technology • Production and trade • Contribution to food security
Corrected Non corrected Trends in World Fleet Capacity 40 30 GrossRegisteredTonnage (106tons) 20 10 0 1990 2000 1970 1980 1960
Number of fishers 40 30 World fishers and fish farmers (in millions) 20 10 1965 1970 1975 1980 1985 1990 1995 2000
Fishing technology • High technology adoption rate; • Improved fishing range and capacity; • Improved preservation and quality; • Improved safety on board • Reduced environmental impact; • Improved MCS
100 Capture 80 60 Million tonnes 40 20 mariculture 0 2000 1990 1950 1960 1970 1980 Production of marine fisheries
Rate of increase of landings 0.15 0.10 0.05 Annual rate of increase 0.00 -0.05 -0.10 1950 1960 1970 1980 1990 2000
Imports Exports 50 50 40 40 US$ Billion dollars 30 30 20 20 10 10 0 0 1993 1999 1993 1999 Developing countries Developed countries Fish trade
Fish and food security 11.0 0.90 10.0 0.80 9.0 0.70 Marine food / capita 8.0 % used for human food 0.60 7.0 0.50 6.0 0.40 5.0 4.0 0.30 1950 1960 1970 1980 1990 2000
2. The Governance • Approaches • Performance • Implementation problems • Regional fishery bodies • Improved frameworks • Ecosystemic considerations • The FAO Code of Conduct
Management approaches • No global inventory; • No universal approach; • Mainly free and open access; • Some limited-entry systems; • Few rights-based systems; • Abundance of “technical measures”; • New global focus: capacity control, MCS, IUU, by-catch, vulnerable species, critical habitats, coral reefs, MPAs,.
Management performance There is room for improvement! • overfishing, collapses, endangered species; • overcapacity, subsidies, economic inefficiencies; • environmental variability; Forecasting; • environmental impact of fishing; habitat, discards; • environmental impact on fishery resources; • compliance (IUU); • Ineffective regional fishery bodies. • Integration into coastal areas management
Implementation problems There are enough principles and guidance, but: • Equity problems: allocation • lack of institutional capacity (e.g. decentralization) • declining capacity in conventional research and statistics • lack of capacity in the new research required • less than effective regional fishery bodies • impact of globalization • Broadening requirements (ecosystems, integration) • Mismatch between ecosystems and jurisdiction boundaries
Regional Fishery Bodies Not effective enough. Not enough power. • failure to accept and implement international instruments; • lack of willingness to delegate responsibility • ineffective enforcement of management measures; • lack of secretariat resources and capacity; • weak decision-making processes; • weak conflict-resolution mechanisms; • inadequate scientific support; • lax use of the scientific advice received.
Improved Frameworks Significant improvement in a decade! • Formal recognition of the overfishing/overcapacity issue • UNCED (1992) • Compliance Agreement (1993) • 1982 Convention intered into force (1994) • UN Fish Stock Agreement (1995) • FAO Code of Conduct (1995) and guidelines • FAO IPOAs • Formal recognition of the need for an ecosystem approach
converging Ecosystemic Considerations Significant changes occurred in the decade! • Conventional management : weakly ecosystemic • Awareness has raised since UNCED (1992) • New instruments are available (CBD) • New programmes are ongoing (ICRI, MPAs) • New collaborations build up: e.g. FAO-CITES, FAO-UNEP • Precautionary approach • Sustainability indicators
FAO Code of Conduct Reflects consensus about : • conservation of the aquatic ecosystems , monitoring & minimisation of environmental impacts of fishing and non-fishing activities; • protection and restoration of fishery resources, their environment, critical habitats, biodiversity, associated and dependent species, and endangered species; • prohibition of destructive fishing • the precautionary approach; • participatory management; • risks related to climate change
The Resources • Many resources require significant improvement in governance to recover or avoid being overfished • The precautionary approach may help if fully applied, using MSY as a limit. • Risk assessment and risk management need to become standard approaches; • An ecosystem perspective is required
The Fishing Industry • It achieved a lot in a difficult environment; • It provides significant benefits; • It benefited a lot from Governments; • It is confronted with increasing societal requirements and a declining resource base; • Its role is fundamental. • It cannot afford not to face responsibilities. Its own sustainability is at stake!!!
The Governance • Conventional governance has spread; • It faces large scale social, economic and environmental problems; • It has improved its framework;...but • ...needs much stronger political will; • Its resources might be insufficient to face broadening societal requirements; • More attention to small-scale fisheries is needed.
Fisheries at the crossroad • Fisheries have significantly contributed to human development and can still do so; • There are problem areas and avenues for positive change; • Change will never be at no cost; but
Global overview of marine fisheries The status quo is not an option ! Thank you