Analyzing Car Bids: Constructing Frequency Distributions and Histograms
100 likes | 219 Views
This guide walks you through the process of creating frequency distributions and histograms based on bids received from selling a car. You will learn to organize data into meaningful patterns using frequency tables that illustrate intervals and respective frequencies. Additionally, it covers essential rules for drawing histograms correctly, including interval size and frequency representation. Understanding these concepts will enhance your data interpretation skills, making it easier to analyze offers and make informed decisions about selling your vehicle.

Analyzing Car Bids: Constructing Frequency Distributions and Histograms
E N D
Presentation Transcript
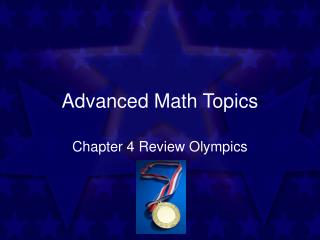
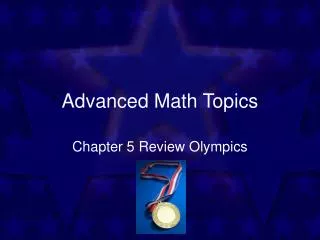
Advanced Math Topics 2.1-2.2 Frequency Distributions and Histograms
You placed an ad on Craigslist to sell your old car. The following bids were received. Construct a frequency distribution and histogram of the data. Frequency distribution-a table that groups data to show meaningful patterns (you can use singletons or intervals) Histogram(frequency histogram)- a bar graph that has intervals on the horizontal axis and the frequency on the vertical axis All histograms are bar graphs but not all bar graphs are histograms… http://mathforum.org/library/drmath/view/61175.html
Frequency Table 1) Find the least and greatest numbers. 2) Between 5 and 15, pick the number of intervals…let’s use 10 intervals. Round, make it easier! 3) Find the size of the interval by… largest value – smallest value 4000 – 2375 1625 = = = 162.5 = 165 # intervals 10 10
average 1 $2375- 2539 2457 I 1 1/50 $165 2 $2540- 2704 2622 0 0 3 $2705- 2869 2787 0 0 These are the main columns!! 4 $2870- 3034 2952 0 0 $3035- 3199 3117 0 0 5 6 $3200- 3364 3282 IIIII IIIII III 13 13/50 7 $3365- 3529 3447 IIIII III 8 8/50 $3530- 3694 3612 IIIII IIIII 10 10/50 8 9 $3695- 3859 3777 IIIII IIII 9 9/50 10 $3860- 4024 3942 IIIII IIII 9 9/50 Class Frequency total frequency Helps us talk about classes easier! Class Average (midpoint) Lower limit-upper limit
Rules for Drawing Histograms • Intervals are of equal size (except possibly the end intervals) • The # of intervals should be 5 through 15 • Intervals do not overlap. If an interval ends with a counting #, the following interval begins with the next # • Any tally falls into 1 and only 1 interval • Bars are next to each other. There are no gaps unless an interval has a frequency of 0
13 9/50 is the relative frequency AND 9/50 is the area of this rectangle compared to the total blue area. The area under any rectangle compared to the total rectangle area is proportional to the relative frequency. 12 11 F R E Q U E N C Y 10 9 The area of any combination of rectangles is proportional to the sum of their relative frequencies. 8 7 6 8/50 5 Add these fractions together to get 21/50. This is also the sum of the areas of both rectangles divided by the total area of all rectangles. 9/50 13/50 4 3 2 1 $2705- $2870- $3035- $3200- $3365- $3530- $3695- $3860- $2375- $2540- 2539 2869 3034 3199 3364 3529 3694 3859 4024 2704 This histogram could help us make decisions about selling our car!! Car Offers
Here is my tallying suggestion: $2375- 2539 $2540- 2704 $2705- 2869 $2870- 3034 $3035- 3199 $3200- 3364 $3365- 3529 $3530- 3694 $3695- 3859 $3860- 4024
From Assignment 2A Together… P. 39 #16
HW P. 35-39 #1, 4, and 16 For #4 do the complete table, for #16 do only the interval and frequency. Create a histogram for both.