Download
1 / 8
80 likes | 199 Views
This project focuses on using Universal Software Radio Peripheral (USRP) hardware for spectrum sensing. Our team, led by Dr. Zhengdao Wang, will develop software to map frequency usage in the 100-800 MHz range and design an application that identifies optimal transmission frequencies. With a connection through USB, we will manage data rates to prevent loss during processing. Our work will primarily utilize C++ for signal processing and Python for block interfacing, ultimately allowing users to set sensing parameters based on a data-driven model of spectrum usage.

E N D
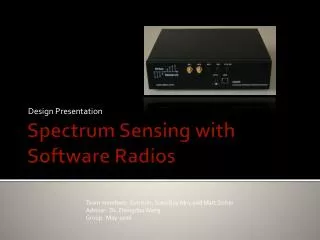
Design Presentation Spectrum Sensing with Software Radios Team members: Eun Kim, Suen Guy Min, and Matt Dolter Advisor: Dr. Zhengdao Wang Group: May-1006
Hardware • We will be using the universal software radio peripheral (USRP) made by Ettus Research • The department already owns several of these
USRP Overview • Interface to PC with USB connection • Data rate needs to be limited to USB bandwidth • USB can handle 32 MB/sec • At 4 Bytes per complex sample, USB can handle 8 M complex samples per second • USRP samples at a rate of 64 M complex samples per second • Therefore decimation by a factor of at least 8 is required for no data loss • Equipped with a TV band receiver • Can receive frequencies from 50-860 MHz • This is larger than the specified range (100-800 MHz)
Software • This is the majority of our project • Signal processing blocks are done in C++ • There is already a pretty extensive library of these • We may or may not need to write our own • Python is used to connect the blocks and run the process • Most of our time will be spent here
Part I • Create a map of the spectrum • A program will be used to collect data • The program will loop over the 100-800 MHz band in increments of 6 MHz • Each iteration will look at 6 Mhz wide bands • Process the data to obtain signal energy over the given band • Run at certain times during the day • The map can then be used to create a model of the spectrum usage for a given day
Part II • Using the model • A user friendly program that will determine the optimal frequency for transmission • It will do the same sort of sensing done in Part I on a smaller scale based on created model • User will be able to set certain sensing parameters