Download
1 / 14
140 likes | 484 Views
Graphs equations and tables. External on the 14 th of November 4 credits Thanks to http://www.studyit.org.nz/subjects/maths/math1/3 / 2011 Ms Allan.

E N D
Graphs equations and tables. External on the 14th of November 4 credits Thanks to http://www.studyit.org.nz/subjects/maths/math1/3/ 2011 Ms Allan
Mathematics 1.3Investigate relationships between tables, equations and graphsLinear equationsSimultaneous linear equationsLinear graphsLinear patternsGraphing parabolasQuadratic equationsQuadratic patternsExponential equations and graphsInterpreting gradients
Linear equations Solve for a,b and c: 3a+6 = 3-4a 3(b + 2) = 15 4c – 9 > c + 7
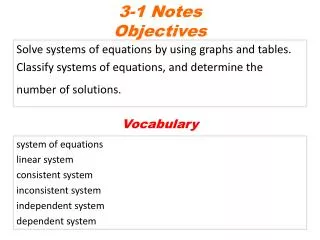
Simultaneous linear equations Solve for A and b A = 3b + 2 A = 6b - 8
Linear graphs Draw these graphs on a set of axis y = 2x + 3 X = 3 Y = 8 Y = -0.5x - 1
Linear patterns For the sequence of diagrams below, find the rule for the number of white tiles (w) in terms of the number of black tiles (b).
Graphing parabolas Draw these graphs on a set of axis y = x2 + 3 y = -x2 + 2 y = (x-4)2 y = (x+4)2 + 1
Quadratic equations What are the x intercepts of Y=(x-3)(x+4) Solve for x by factorising first 0 = x2 + 7x + 12
Quadratic patterns Find a rule for calculating the total number of boxes in each diagram, if the number of boxes in the bottom layer is known. Draw up a table to show the number of boxes in the bottom layer and the total number of boxes in each diagram. Calculate the differences between the terms.
Exponential equations and graphs Draw the graphs of these equations on an x and y axis. Y=2x Y=3x + 2 Y=4x
Interpreting gradients Calculate the gradient of the 3 linear graphs. What do these gradients represent?