Download
1 / 18
180 likes | 355 Views
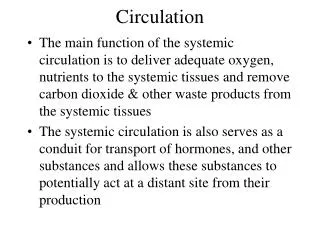
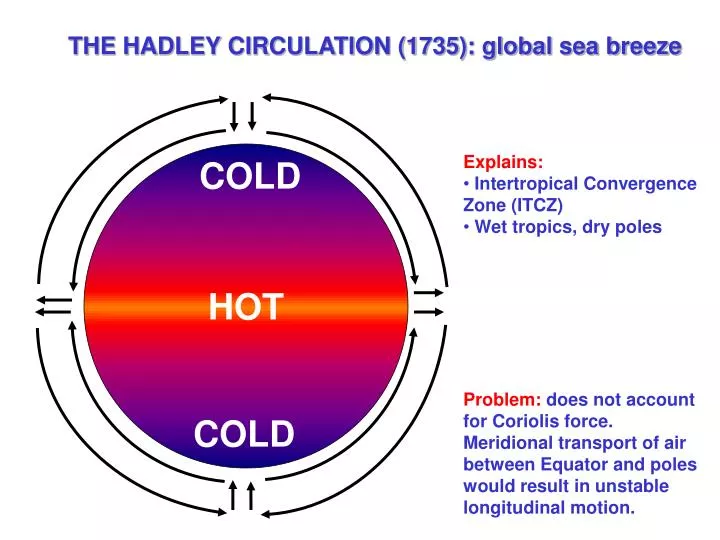
HOT. COLD. COLD. THE HADLEY CIRCULATION (1735): global sea breeze. Explains: Intertropical Convergence Zone (ITCZ) Wet tropics, dry poles Problem: does not account for Coriolis force. Meridional transport of air between Equator and poles would result in unstable longitudinal motion.

E N D
HOT COLD COLD THE HADLEY CIRCULATION (1735): global sea breeze • Explains: • Intertropical Convergence Zone (ITCZ) • Wet tropics, dry poles • Problem: does not account for Coriolis force. Meridional transport of air between Equator and poles would result in unstable longitudinal motion.
GLOBAL CLOUD AND PRECIPITATION MAP20 Feb 2003 @12Z (intellicast.com)
TROPICAL HADLEY CELL • Easterly “trade winds” in the tropics at low altitudes • Subtropical anticyclones at about 30o latitude
TIME SCALES FOR HORIZONTAL TRANSPORT(TROPOSPHERE) 1-2 months 2 weeks 1-2 months 1 year
QUESTIONS 1. Is the general atmospheric circulation stronger (i.e., are the winds faster) in the winter or in the summer hemisphere? 2. Is pollution from North America more likely to affect Hawaii inwinter or in summer? 3. Concentrations of CO2, krypton-85, and other gases emitted mainly inthe northern hemisphere DECREASE with altitude in the northernhemisphere but INCREASE with altitude in the southern hemisphere.Explain.
VERTICAL TRANSPORT: BUOYANCY Balance of forces: • What is buoyancy? z+Dz Object (r) Fluid (r’) z Note: Barometric law assumed a neutrally buoyant atmosphere with T = T’ T T’ would produce bouyant acceleration
“Lapse rate” = -dT/dz ATMOSPHERIC LAPSE RATE AND STABILITY Consider an air parcel at z lifted to z+dz and released. It cools upon lifting (expansion). Assuming lifting to be adiabatic, the cooling follows the adiabatic lapse rateG : z G = 9.8 K km-1 stable z unstable • What happens following release depends on the local lapse rate –dTATM/dz: • -dTATM/dz > Ge upward buoyancy amplifies initial perturbation: atmosphere is unstable • -dTATM/dz = Ge zero buoyancy does not alter perturbation: atmosphere is neutral • -dTATM/dz < Ge downward buoyancy relaxes initial perturbation: atmosphere is stable • dTATM/dz > 0 (“inversion”): very stable ATM (observed) inversion unstable T The stability of the atmosphere against vertical mixing is solely determined by its lapse rate
WHAT DETERMINES THE LAPSE RATE OF THE ATMOSPHERE? • An atmosphere left to evolve adiabatically from an initial state would eventually tend to neutral conditions (-dT/dz = G ) at equilibrium • Solar heating of surface disrupts that equilibrium and produces an unstable atmosphere: z z z final G ATM G ATM initial G T T T Initial equilibrium state: - dT/dz = G Solar heating of surface: unstable atmosphere buoyant motions relax unstable atmosphere to –dT/dz = G • Fast vertical mixing in an unstable atmosphere maintains the lapse rate to G. • Observation of -dT/dz = Gis sure indicator of an unstable atmosphere.
IN CLOUDY AIR PARCEL, HEAT RELEASE FROM H2O CONDENSATION MODIFIES G Wet adiabatic lapse rate GW = 2-7 K km-1 z T RH 100% GW “Latent” heat release as H2O condenses GW = 2-7 K km-1 RH > 100%: Cloud forms G G = 9.8 K km-1
VERTICAL PROFILE OF TEMPERATUREMean values for 30oN, March Radiative cooling (ch.7) - 3 K km-1 Altitude, km 2 K km-1 Radiative heating: O3 + hn e O2 + O O + O2 + M e O3+M heat Radiative cooling (ch.7) Latent heat release - 6.5 K km-1 Surface heating
SUBSIDENCE INVERSION typically 2 km altitude
QUESTIONS 1. An atmosphere with GW < -dT/dz < - G is called "conditionally unstable" (GW is the wet adiabatic lapse rate). Why? 2. Kuwaiti oil fires during the Persian Gulf war produced large clouds of soot a few km above the Earth's surface. Soot absorbs solar radiation. How would you effect such clouds to affect atmospheric stability? 3. Vertical profiles of concentrations of species emitted at the surface often show a "C-shape", particularly in the tropics, with high concentrations in the lower and upper troposphere and low concentrations in the middle troposphere. How would you explain such a profile?
DIURNAL CYCLE OF SURFACE HEATING/COOLING: z Subsidence inversion MIDDAY 1 km Mixing depth NIGHT 0 MORNING T NIGHT MORNING AFTERNOON
FRONTS WARM FRONT: WIND Front boundary; inversion WARM AIR COLD AIR COLD FRONT: WIND WARM AIR COLD AIR inversion
TYPICAL TIME SCALES FOR VERTICAL MIXING • Estimate time Dt to travel Dz by turbulent diffusion: tropopause (10 km) 10 years 5 km 1 month 1 week 2 km “planetary boundary layer” 1 day 0 km