Download
1 / 14
140 likes | 262 Views
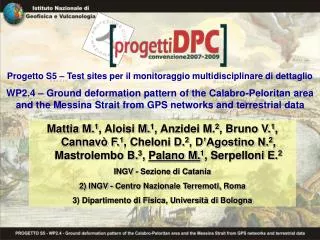
Task 2. Test site “Messina Strait” WP2.5 G. Neri, Univ. Messina Meccanismi dei terremoti e regimi di stress tettonico nell’area dello Stretto di Messina. Focal mechanisms – CAP method. Università di Messina. Department of Earth & Atmospheric Sciences.

E N D
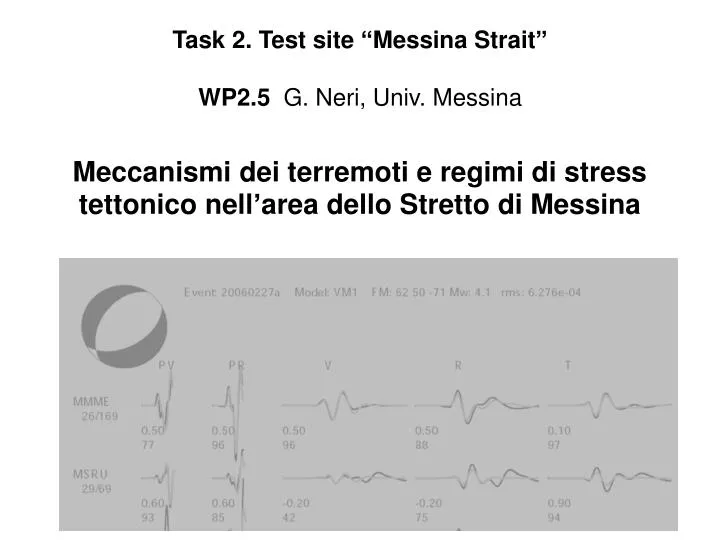
Task 2. Test site “Messina Strait” WP2.5 G. Neri, Univ. Messina Meccanismi dei terremoti e regimi di stress tettonico nell’area dello Stretto di Messina
Focal mechanisms – CAP method Università di Messina Department of Earth & Atmospheric Sciences • We computed the moment tensor solutions using the “Cut And Paste” (CAP) method originally proposed by Zhao and Helmerger (1994) and later modified by Zhu and Helmerger (1996). • The focal mechanisms and source depth are determined using a grid search technique. Each waveform is broken into Pnl and surface-wave segments. • CAP has proven to be effective for analyzing earthquakes even with magnitudes between 2.5 and 4.0
from Barberi et al., 2004 • 23 eqks (M>=3; focal depths less than 25 km; period 2004-2008) • broadband stations of INGV & MedNet
1. si definisce un set di eventi e stazioni valori Vp da tomografia 2. si calcolano i TT teorici relativi nel modello 3D 4. dai fits con la teoria delle dromocrone si ricostruisce il modello 1D “equivalente” travel time (sec) 3. si costruisce il grafico TT vs (km)
TESTS from Barberi et al., 2004 from Barberi et al., 2004 for the present dataset from Neri et al., 2009
RESULTS Black and white in the polar plot correspond to P and T axes, respectively.
Black and white in the polar plots correspond to P and T axes, respectively. Normal faulting resulted to be dominant in sector A, more favourably positioned with respect to the southeast-ward retreat of subduction hinge, while strike-slip components become evident in sector B located across the transfer zone between the extensional and compressional domains.
DATA EARTHQUAKES 97 eqks M>=3.0 Period 2004-2008 3<=M<3.5 M>=3.5
STATIONS • CAT/SCAN Project funded by National Science Fundation • - Lamont Observatory NY • - Dipartimento di Fisica Università della Calabria • Istituto Nazionale di Geofisica e Vulcanologia
Eventi in studio con i dati delle stazioni temporanee “Messina 1908-2008” 45 earthquakes 01/11/2007 - 23/05/2009 Ml>2.5
Next steps… • FM computations with the additional contribution by the INGV experiment data • Comparison and integration with other data available (RCMT, TDMT, EMMA, literature, … ) • Computations of stress fields