Download
1 / 74
800 likes | 1.2k Views
Chapter 12 Analysis of Variance. Section 12-3. The Scheff é Test and the Tukey Test. Chapter 12 Analysis of Variance. Section 12-3. Exercise #9.

E N D
Chapter 12 Analysis of Variance Section 12-3 The Scheffé Test and the Tukey Test
Chapter 12 Analysis of Variance Section 12-3 Exercise #9
The number of grams of fiber per serving for a random sample of three different kinds of foods is listed. Is there sufficient evidence at the 0.05 level of significance to conclude that there is a difference in mean fiber content among breakfast cereals, fruits, and vegetables?
0 3.47 Do not reject the null hypothesis. There is not enough evidence to support the claim that at least one mean is different from the others.
Chapter 12 Analysis of Variance Section 12-3 Exercise #11
The lengths (in feet) of a number of suspension bridges in the United States, Europe, and Asia are shown. At , is there sufficient evidence to conclude that there is a difference in mean lengths?
0 3.98 Do not reject the null hypothesis. There is not enough evidence to support the claim that at least one mean is different from the others.
Chapter 12 Analysis of Variance Section 12-3 Exercise #15
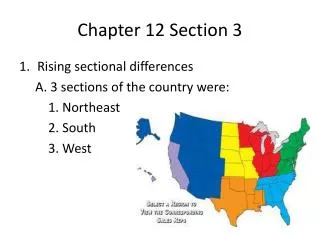
The numbers (in thousands) of farms per state found in three sections of the country are listed below. Test the claim at = 0.05 that the mean number of farms is the same across these three geographic divisions.
0 4.10 Do not reject the null hypothesis. There is not enough evidence to reject the claim that the means are the same.
Chapter 12 Analysis of Variance Section 12-3 Exercise #17
In the following exercise, if the null hypothesis is rejected, use the Scheffé test to test the differences between the means. Assume that all variables are normally distributed, that the samples are independent, and that the population variances are equal.
A research organization tested microwave ovens. At = 0.10, is there a significant difference in the average prices of the three types of ovens?
A computer printout for this exercise is included. Use the P-value method and the information in the printout to test the claim. ANALYSIS OF VARIANCE SOURCE TABLE Source df SS MS Between 2 21729.735 10864.867 Within 19 20402.083 1073.794 Total 21 42131.818 F P-value 10.118 0.00102 DESCRIPTIVE STATISTICS Condit N Means St Dev 1000 6 233.333 28.23 900 8 203.125 39.36 800 8 155.625 28.21
= 0.10 P-value = 0.00102 Reject since P-value < 0.10. At least one mean is different from the others.
Test the differences between the means. Scheffé Test
Test the differences between the means. Scheffé Test Not Significant
Test the differences between the means. Scheffé Test Significant
Test the differences between the means. Scheffé Test Significant
Test the differences between the means. Scheffé Test
Chapter 12 Analysis of Variance Section 12-4 Two-Way Analysis of Variance
Chapter 12 Analysis of Variance Section 12-4 Exercise #11
A medical researcher wishes to test the effects of two diets and the time of day on the sodium level in a person’s blood. Eight people are randomly selected, and two are randomly assigned to each of the four groups. Analyze the data shown in the tables here, using a two - way ANOVA at = 0.05. The sodium content is measured in milliequivalents per liter.
H0: There is no interaction effect between the time of day and the type of diet in a person’s sodium level. H1: There is an interaction effect between the time of day and the type of diet in a person’s sodium level. H0: There is no difference between the means for the sodium level for the times of day. H1: There is a difference between the means for the sodium level for the times of day.
H0: There is no difference between the means for the sodium level for the type of diet. H1: There is a difference between the means for the sodium level for the type of diet.
Factor A: (Time) d.f.N = a – 1 = 2 – 1 = 1 Factor B: (Diet) d.f.N = b – 1 = 2 – 1 = 1 Interaction (A X B): d.f.N = (a – 1)(b – 1) = 1 Within (error): d.f.D = ab(n – 1) = 2(2)(2 – 1) = 4 The critical value at = 0.05 with d.f.N = 1 and d.f.D = 4 is 7.71 for FA, FB, and FAxB.
Factor A: (Time) d.f.N = 1 Factor B: (Diet) d.f.N = 1 d.f.N = 1 Interaction (A X B): d.f.D = 4 Within (error):
0 7.71 Since the only F test value that exceeds 7.71 is the one for the time, 25.806, it can be concluded that there is a difference in the means for the sodium level taken at two different times.
H0: There is no interaction effect between the time of day and the type of diet in a person’s sodium level. H1: There is an interaction effect between the time of day and the type of diet in a person’s sodium level. H0: There is no difference between the means for the sodium level for the times of day. H1: There is a difference between the means for the sodium level for the times of day.
H0: There is no difference between the means for the sodium level for the type of diet. H1: There is a difference between the means for the sodium level for the type of diet.