Download
1 / 1
10 likes | 211 Views
21 Pathways. From Kyoto Encyclopedia of Genes and Genomes (KEGG). Genetic Information Processing Ribosome Polymerases tRNA Proteasome Cellular Processes Cell Cycle Apoptosis Cell Adhesion Environmental Information Processing MAP Kinase PI Kinase Human Diseases

E N D
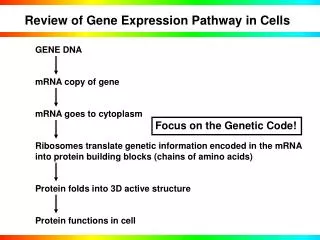
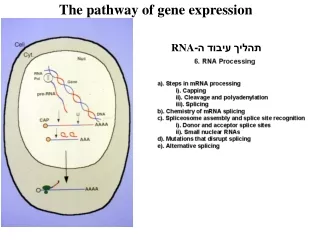
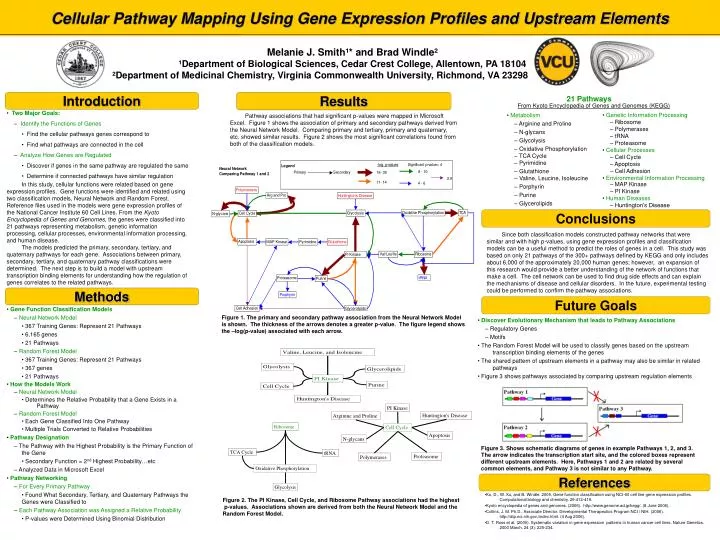
21 Pathways From Kyoto Encyclopedia of Genes and Genomes (KEGG) • Genetic Information Processing • Ribosome • Polymerases • tRNA • Proteasome • Cellular Processes • Cell Cycle • Apoptosis • Cell Adhesion • Environmental Information Processing • MAP Kinase • PI Kinase • Human Diseases • Huntington’s Disease • Metabolism • Arginine and Proline • N-glycans • Glycolysis • Oxidative Phosphorylation • TCA Cycle • Pyrimidine • Glutathione • Valine, Leucine, Isoleucine • Porphyrin • Purine • Glycerolipids Figure 1. The primary and secondary pathway association from the Neural Network Model is shown. The thickness of the arrows denotes a greater p-value. The figure legend shows the –log(p-value) associated with each arrow. Figure 3. Shows schematic diagrams of genes in example Pathways 1, 2, and 3. The arrow indicates the transcription start site, and the colored boxes represent different upstream elements. Here, Pathways 1 and 2 are related by several common elements, and Pathway 3 is not similar to any Pathway. Figure 2. The PI Kinase, Cell Cycle, and Ribosome Pathway associations had the highest p-values. Associations shown are derived from both the Neural Network Model and the Random Forest Model. Melanie J. Smith¹* and Brad Windle² ¹Department of Biological Sciences, Cedar Crest College, Allentown, PA 18104 ²Department of Medicinal Chemistry, Virginia Commonwealth University, Richmond, VA 23298 Cellular Pathway Mapping Using Gene Expression Profiles and Upstream Elements Results Introduction • Two Major Goals: • Identify the Functions of Genes • Find the cellular pathways genes correspond to • Find what pathways are connected in the cell • Analyze How Genes are Regulated • Discover if genes in the same pathway are regulated the same • Determine if connected pathways have similar regulation Pathway associations that had significant p-values were mapped in Microsoft Excel. Figure 1 shows the association of primary and secondary pathways derived from the Neural Network Model. Comparing primary and tertiary, primary and quaternary, etc. showed similar results. Figure 2 shows the most significant correlations found from both of the classification models. In this study, cellular functions were related based on gene expression profiles. Gene functions were identified and related using two classification models, Neural Network and Random Forest. Reference files used in the models were gene expression profiles of the National Cancer Institute 60 Cell Lines. From the Kyoto Encyclopedia of Genes and Genomes, the genes were classified into 21 pathways representing metabolism, genetic information processing, cellular processes, environmental information processing, and human disease. The models predicted the primary, secondary, tertiary, and quaternary pathways for each gene. Associations between primary, secondary, tertiary, and quaternary pathway classifications were determined. The next step is to build a model with upstream transcription binding elements for understanding how the regulation of genes correlates to the related pathways. Conclusions Since both classification models constructed pathway networks that were similar and with high p-values, using gene expression profiles and classification models can be a useful method to predict the roles of genes in a cell. This study was based on only 21 pathways of the 300+ pathways defined by KEGG and only includes about 6,000 of the approximately 20,000 human genes; however, an expansion of this research would provide a better understanding of the network of functions that make a cell. The cell network can be used to find drug side effects and can explain the mechanisms of disease and cellular disorders. In the future, experimental testing could be performed to confirm the pathway associations. Methods Future Goals • Gene Function Classification Models • Neural Network Model • 367 Training Genes: Represent 21 Pathways • 6,165 genes • 21 Pathways • Random Forest Model • 367 Training Genes: Represent 21 Pathways • 367 genes • 21 Pathways • How the Models Work • Neural Network Model • Determines the Relative Probability that a Gene Exists in a Pathway • Random Forest Model • Each Gene Classified Into One Pathway • Multiple Trials Converted to Relative Probabilities • Pathway Designation • The Pathway with the Highest Probability is the Primary Function of the Gene • Secondary Function = 2nd Highest Probability…etc • Analyzed Data in Microsoft Excel • Pathway Networking • For Every Primary Pathway • Found What Secondary, Tertiary, and Quaternary Pathways the Genes were Classified to • Each Pathway Association was Assigned a Relative Probability • P-values were Determined Using Binomial Distribution • Discover Evolutionary Mechanism that leads to Pathway Associations • Regulatory Genes • Motifs • The Random Forest Model will be used to classify genes based on the upstream transcription binding elements of the genes • The shared pattern of upstream elements in a pathway may also be similar in related pathways • Figure 3 shows pathways associated by comparing upstream regulation elements References • Ko, D., W. Xu, and B. Windle. 2005. Gene function classification using NCI-60 cell line gene expression profiles. Computational biology and chemistry. 29:412-419. • Kyoto encyclopedia of genes and genomes. (2006). http://www.genome.ad.jp/kegg/.(8 June 2006). • Collins, J. M. Ph.D., Associate Director. Developmental Therapeutics Program NCI / NIH. (2006). http://dtp.nci.nih.gov./index.html. (4 Aug 2006). • D. T. Ross et al. (2000). Systematic variation in gene expression patterns in human cancer cell lines. Nature Genetics. 2000 March, 24 (3): 225-234.