Download
1 / 2
20 likes | 163 Views
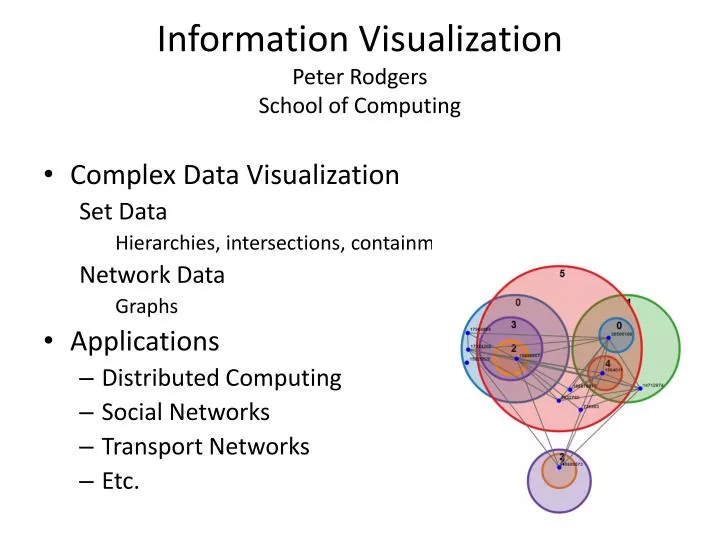
Information Visualization Peter Rodgers School of Computing. Complex Data Visualization Set Data Hierarchies, intersections, containment Network Data Graphs Applications Distributed Computing Social Networks Transport Networks Etc. Visualizing Big Data.

E N D
Information VisualizationPeter RodgersSchool of Computing • Complex Data Visualization Set Data Hierarchies, intersections, containment Network Data Graphs • Applications • Distributed Computing • Social Networks • Transport Networks • Etc.
Visualizing Big Data • Why use information visualization? • Analysis, gain understanding and insight • Communication, communicate salient points • Scaling: a problem not yet solved The matra “Overview first, zoom and filter, then details-on-demand.”[Shneiderman, 1996] • How do we automatically layer sets, combined visualizations, or attributed data? • What and when to filter • Algorithmic complexity Burch and Cheswick's Internet Mapping Project