Download
1 / 15
150 likes | 274 Views
Learning Progressions in Climate Change Education Research. J. Randy McGinnis Wayne Breslyn. Chris McDonald Emily Hestness. Project Overview. Maryland and Delaware Climate Change Education, Assessment, and Research (MADE CLEAR)

E N D
Learning Progressions in Climate Change Education Research J. Randy McGinnis Wayne Breslyn Chris McDonald Emily Hestness
Project Overview • Maryland and Delaware Climate Change Education, Assessment, and Research (MADE CLEAR) • 5-year project supported by NSF Phase II Climate Change Education Partnership (CCEP) grant • Partners include: • Core institutions in DE and the University System of MD • Maryland and Delaware Departments of Education • Maryland Public Television
Research Goals with Learning Progressions To investigate: • how teaching a particular climate change impact helps students in a particular geographic region to learn about climate change science. • how teachers can use these hypothetical learning progressions to teach about climate change science. • growth over time of students’ knowledge of climate change.
Learning Progressions “Fundamentally speaking, LPs are hypothetical constructs that model learning in a domain. They include conjectures about the type, number, and order of levels (or steps) learners go through as they develop expertise in the domain.” (Shea & Duncan, 2012) “… are seen as de riguerestrategies for formulating and developing environments of learning that align curriculum, instruction and assessment.” (Duschl et al., 2011)
Learning to Ride a Bike: What Knowledge is Needed to Keep Progressing More advanced understanding over time.
Three Climate Change Learning Progressions • Extreme Weather • Sea Level Rise • Urban Heat Island Effect
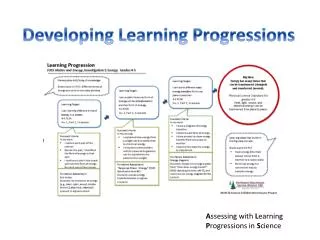
Background Our hypothetical learning progressions are structured based on Andy Anderson's research team's work on carbon cycling (2009) and energy (2012). The NGSS provided guidance on core disciplinary climate change constructs and impacts.
Example Progression: Sea Level Rise For Sea Level Rise we have four components to our hypothetical learning progression: • Causes • Impacts • Mechanisms • Representations
Example Progression: Sea Level Rise The following is a draft hypothetical learning progression for the Impacts of Sea Level Rise.* * Based on our review of the NGSS. Still needs to be empirically validated.
Impacts of Sea Level Rise Level 1 Students identify that an impact of sea level rise is that some land in coastal areas and islands will be underwater, though they are not able to elaborate on specific consequences of sea level rise.
Impacts of Sea Level Rise Level 4 Students understand that local sea level changes can differ from global trends based on regional variations in factors such as geographic uplift or subsidence and ocean currents. Students are able to elaborate on specific consequences of local sea level rise. Students recognize that sea level rise projections are based on available data and may be lower or higher than predicted.
Data Collection Data collection and analysis often consists of different methods at different points in research (Shea & Duncan, 2011). In addition to the use of interviews, observations, and instructional interventions the validation work of Neumann et al. (2013) has influenced our research.
Sample Assessment Instrument Question The picture above shows an aerial view of a coastal land area that is projected to experience significant sea level rise. How would the land in the picture above be impacted if the sea level were to rise by one meter? A. There will be no change since the land will also rise.B. Some or all of the land will become submerged by water. C. There will be no change since sea water will spread out around the land.D. Some of the land that was originally under water would no longer be under water.
Sample Assessment Instrument Question The graph above represents sea level rise projections based on several different scientific models. Which of the following is the best description of the scientific projections of sea level rise in the above graph? A. Sea level rise projections are based on available data and may be lower or higher than predicted.B. Sea level rise projections are based on available data and tell us the exact amount sea level will rise.C. Sea level rise projections are not reliable because they are based on scientists’ opinions, which can be wrong.D. Sea level rise projections are not useful because it is impossible to predict what will happen in the future.
Thank you! J. Randy McGinnis Wayne Breslyn Chris McDonald Emily Hestness This material is based upon work supported by the National Science Foundation under Grant No. 1043262. Any opinions, findings, and conclusions or recommendations expressed in this material are those of the author(s) and do not necessarily reflect the views of the National Science Foundation.