Download
1 / 21
210 likes | 423 Views
Euroheat & Power Conference Brussels, 22 June 2006 Electricity Markets Outlook to 2030: Challenges and Opportunities Francois Nguyen Senior Policy Advisor Office of Long-Term Co-operation and Policy Analysis. World Energy Investment 2004-2030. Total investment: 17 trillion dollars. Gas 18%.

E N D
Euroheat & Power Conference Brussels, 22 June 2006Electricity Markets Outlook to 2030: Challenges and OpportunitiesFrancois NguyenSenior Policy Advisor Office of Long-Term Co-operation and Policy Analysis
World Energy Investment 2004-2030 Total investment: 17 trillion dollars Gas 18% Power Generation 46% Electricity 61% Oil 19% 54% T&D Coal 2% The power sector will need $10 trillion, over 60% of total energy-related investment
Electricity Market Context • Market reforms at varying stages of implementation worldwide • Most advanced in OECD countries • Pace slow but steady • Surging fossil-fuel prices make investment climate uncertain • Blackouts in some OECD countries have heightened concerns about system reliability and generation adequacy • Governments increasingly looking to energy efficiency and renewables to promote sustainability • Current market instability and uncertainties complicate preparation of long-term strategies
Generating Capacity Requirements 2004-2030 China OECD North America OECD Europe Other Asia Transition economies OECD Pacific Africa India Other Latin America Middle East Brazil Indonesia 0 100 200 300 400 500 600 700 800 900 GW Under construction Planned Additions needed by 2030 Some regions need to speed up investment to prevent the ‘lights going out’
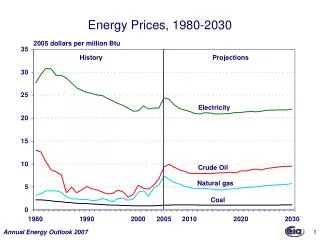
World Electricity Generation 14 000 12 000 10 000 8 000 TWh 6 000 4 000 2 000 0 2004 2030 Coal Oil Gas Nuclear Hydro Other renewables Gas-based electricity production will triple, but coal will remain the dominant fuel worldwide
Power Sector CO2 Emissions Coal 2004 Gas Oil Coal 2030 Gas Oil 0 2 000 4 000 6 000 8 000 10 000 12 000 Mt of CO 2 OECD Developing countries Transition economies In 2030, coal plants in developing countries will produce more CO2 than the entire power sector in the OECD
Age of Installed Capacity Age of Installed Capacity in Europe 140 120 100 80 Oil GW Gas Coal 60 Nuclear 40 20 0 < 10 years 10 - 20 years 20 - 30 years > 30 years Europe's power plants are ageing: more than half the current capacity could be retired by 2030
EU-25 Capacity Increases, 2005-2030 1200 1000 800 GW 600 400 200 0 2005 2010 2015 2020 2025 2030 Existing New
EU-25 Electricity Generation, 1990-2030 4500 4000 3500 3000 2500 2000 1500 1000 500 0 1990 1995 2000 2005 2010 2015 2020 2025 2030 Coal Oil Gas Nuclear Hydro Wind Other renewables
Share of Natural Gas in Electricity Generation in EU The share of gas in power generation increases from 19% today to 34% in 2030
Key Policies in Alternative Scenario for European Union Power generation • Renewable energy directive • CHP directive • Transport sector • Prolongation and tightening of Voluntary Agreement with car manufacturers • Biofuels target Residential and commercial sectors • Energy performance in buildings directive • Energy labelling
Share of Non-Hydro Renewables in Electricity Generation, 2030 New policies would boost the share of non-hydro-renewables in EU power generation – already the highest in the world
Share of CHP Electricity 25% 2030 AS 20% 2030 RS 15% 2004 10% 5% 0%
5 000 5 000 4 500 4 500 4 000 4 000 2 2 Mt of CO Mt of CO 3 500 3 500 Kyoto Target 3 000 3 000 2 500 2 500 2 000 2 000 1990 1990 2000 2000 2010 2010 2020 2020 2030 2030 Reference Scenario Alternative Scenario EU CO2 Emissions in the Reference & Alternative Scenarios With new policies, EU CO2 emissions stabilise by 2010 and fall after 2020
Comparison of Various Electricity Generating Options (1) • Gas CCGT • Main choice in 1990s and continuing (significant increases by 2010) • Lowest capital cost (~$550/kW), quick cost recovery, low risk in liberalised markets • Low CO2 emissions per kWh (less than half the emissions of a coal plant) • Very low or zero emissions of SO2, NOx, particulates • Flexibility (can be operated at different load factors) • Short construction time (~2 years now) • Fuel costs 70% to 80% of total costs – sensitive to fuel price changes (high and volatile gas prices) • Security of supply in gas-importing countries
Comparison of Various Electricity Generating Options (2) • On site CHP • Saves fuel • Saves emissions • Saves investment in network • Heat load required for efficient operations • Main options: gas and biomass • Regulatory issues
Comparison of Various Electricity Generating Options (3) • Coal • High initial investment (twice the cost of CCGT, $1000 to $1200 per kW) • High CO2 emissions per kWh • Additional costs for scrubbers • Longer construction time (4-5 years) • Low and relatively stable fuel costs • Coal: abundant reserves, stable supply
Comparison of Various Electricity Generating Options (4) • Wind • High initial investment ($1000 per kW) • No fuel costs • No emissions • Economics fairly good at windy locations • Variable output- additional costs for backup and grid reinforcement (additional cost $5 to $15 per MWh)
Comparison of Various Electricity Generating Options (5) • Nuclear • Large initial investment ($1700 to $2000 per kW) • Low fuel costs – stable generating costs • No CO2 emissions, no SO2, NOx, particulates • Public acceptance (waste, proliferation) • Secure, sustained power
WEO 2006: Main Themes • World Alternative Policy Scenario • Beyond the Alternative Scenario • Impact of high energy prices • Energy Investment Prospects • Outlook for Biofuels • Sustainable Use of Biomass • Outlook for Nuclear Power • Country in focus: Brazil
Summary & Conclusions • Electricity sector will dominate global energy investment needs • About 5 000 GW of new capacity will be needed to meet rising electricity demand and plant retirements • Generation mix will change over the next two decades • More vigorous policies would curb rate of increase in energy demand and emission significantly • Energy efficiency (including CHP), renewables and nuclear can play a role in promoting sustainability • CHP has the potential to increase its share and can benefit from government and regulatory policies