Download
1 / 78
780 likes | 899 Views
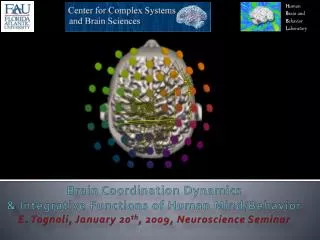
Using Graphs to Mine Brain Dynamics. Introduction. Metho do logical framework (short description). Application to Auditory M100-responses to detect the influence of attention. Future trends.

E N D
Using Graphs to Mine Brain Dynamics
Introduction Methodological framework (short description) Application to Auditory M100-responses to detect the influence of attention Future trends
A "graph" is collection of vertices (or 'nodes‘)and a collection of edges that connect pairs of vertices. ‘‘Seven Bridges of Königsberg’’ Initiated with Euler’s paper in 1736 Introductory comments Graph theory is the study of graphs: mathematical structures used to model pairwise relations between objects from a certain collection.
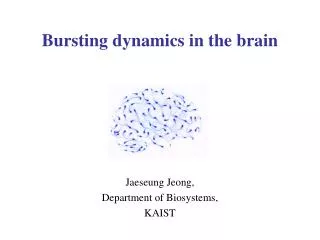
created by O. Sporns Graphs in Brain Research : network analysis (small-world network) systems-approach (MI-maps)
Graphs for Single-TrialAnalysis • Past Liu, Ioannides, Gartner Elect. and clinical Neurophysiology 106 (1998) 64–78 • Current-practise • Future-trends (mining informationfrom multisite recordings)
I. Outline of our methodological approach A synopsis of response dynamics and its variability by means of Semantic Geodesic Maps Graphs play an instrumental role in : computing neighborhood relations, deriving faithfull visualizations of reduced dimensionality describing and contrasting the essence of response variability in an objective way MST, WW-test , ISOMAP, Laplaceans , commute times, etc Brain dynamics can be compared at a glance
IEEE SP Magazine, 2004 [ Laskaris & Ioannides, 2001 & 2002 ]
Step_the spatiotemporal dynamics are decomposed Design of thespatial filterused to extractthetemporal patternsconveyingtheregional response dynamics
Clustering & Vector Quantization Feature extraction Embedding in Feature Space Minimal Spanning Treeof the codebook Interactive Study of pattern variability Orderly presentation of response variability MST-ordering of the code vectors Step_ Pattern & Graph-theoretic Analysisof the extracted ST-patterns
- Step_Within-group Analysisof regional response dynamics
Step_Within-group Analysis of multichannel single-trial signals
Step_Within-group Analysis of single-trial MFT-solutions
Wald-Wolfowitztest (WW-test) {Xi}i=1...N vs {Yj} j=1...M R=12 Dissimilar Similar P-value 0 A non-parametric test for comparing distributions
II. Application to MEG Auditory (M100) responses The Scope : to understand the emergence of M100-response (in averaged data) characterize its variablility (at Single-Trial level) and describe the influence (if any) of attention
The Motive :‘‘ New BCI approaches based on selective Attention to Auditory Stimulus Streams ’’N. Hill, C. Raths (mda_07) Exogenous (i.e. stimulus-driven) BCI's rely on the conscious direction of theuser's attention. For paralysed users, this means covert attention Covert attention do affect auditory ERPs.
MEG-data were recorded at RIKEN (BSI, Japan) CTF-OMEGA (151-channels)
Repeated stimulation ( ISI: 2sec ) Count # 2 sec binaural-stimuli [ 1kHz tones, 0.2s, 45 dB ], passive listening task ( 120 trials ) & attenting task ( 120 ± 5 trials ) right-hemisphere response left-hemisphere response
IIa. Ensemble characterization of (M100-related) brain waves [ 3-20 ] Hz IIb. Unsupervised classification of (M100-related) brain waves and Prototyping IIc. Empirical Mode Decomposition for enhancing(M100-related) brain waves mutiscale analysis single-channel ICA for oscillatory components
IIa. Ensemble characterization of (M100-related) brain waves
time-aligned ST-segments are extracted brought to common feature space and subsequenlty transfromed ( via MDS ) to point-diagrams representing brain-waves relative scattering
Attentive-responses show significantly reduced scattering : smaller MST-length
normalize Clustering tendencies are apparent in phase-representation space and higher for theattentive responses
Similar observations can be made for the other hemisphere of the same subject
The variability of (snaphosts of) Brain-waves is smaller for the attentive task
The clustering of (snaphosts of) Brain-waves is higher within the phase-representation domain
IIb. Unsupervised classification of (M100-related) brain waves and Prototyping
Discriminative Prototyping Discriminative Prototyping Kokiopoulou & Saad, Pattern Recognition : ‘‘Enhanced graph-based dimensionality reduction with repulsion Laplaceans’’ By contrasting brain-waves from control condition against the M100-related brain waves we deduce an abstract space wherein Neural-Gas based Prototyping is first carried out and then prototypes are ranked based on an ‘‘SNR-classification index’’
D-r2 Laplacean & eigenanalysis D-r1 Repulsion-graph
By embedding brain-waves from control condition, we can the define high-SNR regions in the reduced-space Exploiting the abundance of spontaneous brain activity snapshots, we can accurately/precisely rank the differnt voronoi regions.
The derived ranks are utilized to order the prototypical responses accordingly
Taking a closer look at the high-SNR group of STs, a ‘highlighting’ of response dynamics is achieved
that can be enhanced via a ‘‘Trial-Temporal’’ format There is an apparent organization in the brain waves @ 100 ms
And be enriched via contrast with the ‘void-of-M100-response’ ST-group
There is lack of any kind of organization in the brain waves
Even for theattentive-taskthere are ST-groups‘void-of-M100’
The high-SNR group of STs, clearly shows a phase-reorganization of prestimulus activity accompanied with an enhancement of oscillations
Similar observations can be made for the other hemisphere of the same subject