Download
1 / 24
240 likes | 420 Views
Guide to the Surface Water Record. This is a guide for interpreting and using the maps and other data provided by the Record. It also provides some interesting examples of surface water variability, as observed and measured through this remote sensing technology.

E N D
Guide to the Surface Water Record • This is a guide for interpreting and using the maps and other data provided by the Record. • It also provides some interesting examples of surface water variability, as observed and measured through this remote sensing technology. Brakenridge, G.R. and Kettner, A.J., 2013, “Guide to the Surface Water Record”, Dartmouth Flood Observatory, University of Colorado, Boulder, CO, USA, http://floodobservatory.colorado.edu/
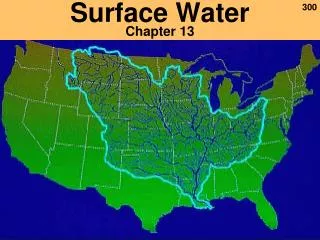
The Surface Water Record is a collection of online map displays, each measuring 10 deg long. x 10 deg lat., accessed by clicking on one of the map sheets illustrated above in the Dartmouth Flood Observatory home page: http://floodobservatory.colorado.edu/. These also provide links to GIS data supporting the displays. This 20 year long effort, led by Bob Brakenridge, has been sustained by grants and contracts from NASA, the European Commission, the World Bank, and other sources, and by Dartmouth College and the University of Colorado. Version 3 will be fully automated.
In the version 3 Record, the reference water is unchanging. It is the NASA Space Shuttle SRTM mission (90 m) SWBD data, February 11-23, 2000. All of the maps presented here are from version 3, and they each show MODIS-sensed water on particular dates in April, 2013 compared to the SWBD water. Map Symbology Large areas of purple are now dry land (but were water in 2000). Very small areas of purple (<.25 km wide) are water bodies mapped by SWBD, but are too small to be mapped by MODIS. Dark blueis current surface water, imaged by both MODIS and by SWBD (not flooding). Bright blueis flooding: expanded water areas mapped by MODIS compared to SWBD. Very light blue-gray is all previous flooding imaged and mapped by the Dartmouth Flood Observatory. Elephant Butte Reservoir and surrounding areas, New Mexico, showing drought-caused reduced surface water.
Flooding (bright blue) along the extensive floodplain of the Lower Mississippi River, USA, April, 2013. • Also shown is normal water (dark blue) and maximum observed flood extent (light blue-gray). • Notes: • Only modest flooding is occurring as of this map date; flooding is contained within previously mapped limits. • Progressive mapping of flooding over the years has delineated “the floodplain”. • Narrow purple areas are water bodies mapped in the SWBD at higher spatial resolution (not discernable by MODIS).
Large reservoir status near Oxford, Mississippi, USA, April, 2013. From north to south, the Sardis, Enid, and Grenada reservoirs are shown. Shrinkage of Sardis surface water extent compared to February 2000 is shown in purple. Light blue-gray is maximum water extent so far imaged. All of the reservoirs extended far upstream during past intervals of wet conditions and flooding. From:http://floodobservatory.colorado.edu/Version3/090W040Nv3.html
Many wetlands around the world are being monitored by the Record. For example, “The country’s largest interior marsh, Cheyenne Bottoms, Kansas, is the top shorebird staging area in the continental United States, a resting and refueling area for more than half of all shorebirds that migrate east of the Rockies. That includes 90% of North America’s population of Wilson’s phalarope, long-billed dowitcher, white-rumped sandpiper, Baird’s sandpiper, and stilt sandpiper… “ “Named a "Wetland of International Importance" by the Ramsar Convention on Wetlands, Cheyenne Bottoms is threatened by conversion to agriculture and diminishing water supply.” http://www.kansaswetlandsandwildlifescenicbyway.com/cheyenne-bottoms
April 2013, MODIS surface water status (completely dry): a small cropped subscene from the Record map sheet. Light blue-gray is the maximum water extent observed by MODIS (May 12, 2007); now dry land. Purple is water imaged in February 2000 (SWBD data), now also dry land. From: http://floodobservatory.colorado.edu/Version3/100W040Nv3.html
Cheyenne Bottoms, June 18, 2010 (“average summer”). Landsat image from http://earthobservatory.nasa.gov/IOTD/view.php?id=79337
Cheyenne Bottoms, July 17, 2012 (severe drought, “driest and second-hottest summer on record. Dry conditions continued into early April, 2013
The MODIS-derived record of flooding in the northern Mississippi River Embayment, southcentral USA (light blue-gray). Heavy rains fill rivers entering this large river alluvial plain from the west; the flooding flows southward for long distances before joining the Mississippi. The map shows not only future flood hazard, but the large scale flood drainage network. At this map update, in April, 2013, “normal” flow conditions prevail (bright blue areas are very limited). Subscene from: http://floodobservatory.colorado.edu/Version3/100W040Nv3.html
Status of Lake Marion, South Carolina, between Sumter and Orangeburg. At time of this map update, in April, 2013, the reservoir extended past the February 2000 reference water (extension shown as bright blue areas), but flood water has not reached the maximum extent previously mapped (light blue gray) Bright blue fringes around other reservoirs indicate that they also are high. Subscene from: http://floodobservatory.colorado.edu/Version3/090W040Nv3.html
Status of Indus River, Pakistan, in April 2013 (dark and bright blue colors) compared to past flooding (light blue-gray). The catastrophic flood of 2010 breached levees in the northern portion of this scene; much of the flood water flowed far to the west, inundating lower terrain bordering the broad alluvial ridge occupied by the river. Subscene from: http://floodobservatory.colorado.edu/Version3/060E030Nv3.html See also Syvitski, J.P.M. and Brakenridge, G.R., 2013, “Causation and avoidance of catastrophic flooding along the Indus River, Pakistan”. GSA Today, v. 23, p. 4-10.
Upstream Indus River and tributaries. The Chasma reservoir on the upper Indus is now extended past its February 2000 state. Narrow bright blue strips along the Indus channel indicates channel change compared to February 2000. Also shown is the maximum flooding observed (light blue-gray): important information for flood hazard assessment. From: http://floodobservatory.colorado.edu/Version3/070E040Nv3.html
Sistan Lake (large purple area): an ephemeral water body in the arid lands along the Afghanistan/Iran border. The lake is dry in this April, 2013 map. Hamun lake, the small water body to the south of Zabol, is full. Episodes of flooding were previously mapped in the area. They are recorded by dated GIS files in the Record’s “Surface Water Archive”; here all files are merged as light blue-gray. From: http://floodobservatory.colorado.edu/Version3/060E040Nv3.html
Status of Rana Pratap Sagar (top) and Gandhi Sagar (bottom) India, in April, 2013 The northern lake today matches its February, 2000 extent. The southern lake is much extended, and drains into the former. Thus, the two-reservoir system exhibits much greater combined water storage in April, 2013 than that in February 2000. From: http://floodobservatory.colorado.edu/Version3/070E030Nv3.html
Mahanadi River delta, India. This portion of the Record map sheet shows extensive flooding in the recent past; both upstream along the Mahanadi, above Cuttack, and also in the delta and other shoreline (in some cases, from tropical storm surges) On the day of map update, in April 2013, no significant flooding was occurring. Salandi Reservoir northwest of Kuparj is mapped as purple (dry). It may fill again during the wet season. Sedimentation has greatly reduced the storage capacity of this reservoir. From: http://floodobservatory.colorado.edu/Version3/080E030Nv3.html
Monitoring of lakes in Tanzania. Lake Natron, at the border with Kenya, is full; Lake Eyasi, to the southwest, is lower than in February 2000 (note purple area marking new dry land). Much smaller Lake Kitangiri further to the southwest is much expanded. To the south, Lake Sulunga to the south is much reduced. Numerical area values can be obtained from the GIS files. From: http://floodobservatory.colorado.edu/Version3/030E000Sv3.html
No surface water is imaged and mapped by MODIS in this northern India, April, 2013 Record subscene (but note channel changes of the Ganges, in bright blue). During the summer monsoon, flood water will once again be observed, and its maximum extent can then be compared to previous monsoons. Each year, some of the light gray-blue areas are reoccupied by water. In the online Record, the black dot (#52) is clickable and provides river discharge measurements, 1998-present (next slide) In 2008, a breach of the east levee of the Kosi River, upper part of this subscene, allowed flood water to spill out over large areas of Bihar (light blue-gray), causing 250 fatalities and displacing 3 million. This river avulsion is recorded for posterity in the Surface Water Record map sheet, and in more detail.
The 1998-present daily discharge time series (bottom plot) and the most recent part of same record (upper plot) at river measurement site 52 on the Kosi River. Note the large (but not flood of record) discharge associated with the levee breach in 2008.
In 2011, abundant rainfall upstream of Bangkok, Thailand, filled floodplains and reservoirs, and over several weeks time flooding eventually reached Bangkok (light blue-gray). As for the previous slide, this portion of the relevant Surface Water Record map sheet shows little surface water in April, 2013, but provides a guide to past and future monsoon season flooding. From: http://floodobservatory.colorado.edu/Version3/100E020Nv3.html
Complete 10 degree map sheet for a portion of the northern central USA and Canada, in April, 2013. Light blue-gray maps previous flooding along the Red River valley (northern portion of map) and, far to the south, in Iowa. Permanent water mapped by both the SWBD and MODIS is shown as the western portions of Lake Superior (upper center right). Bright blue shows current spring flooding in the wetlands and agricultural areas of southern Minnesota. In northern Minnesota and southern Canada,extensive purple areas are ice-covered lakes (mapped as dry land). The maps record the spring thaw each year as this water transitions from purple to blue. From: http://floodobservatory.colorado.edu/Version3/100W050Nv3.html
Accessing Surface Water Record Data The maps and associated GIS data provide current surface water extent and the observed recent history of changes (since DFO began mapping floods, in 1993, but with most data commencing in yr 2000). Surface water expansions and contractions are both illustrated. Mapped water expansions may be short-term, from inland flooding or storm surges. Or long-term, from post-2000 reservoir construction and increases in rice agriculture or aquaculture. Reductions in surface water may also be short-term, from drought conditions, or long term (some shrinking wetlands). The Record maps provide some but not all of the information contained in the GIS files. The GIS files can be analyzed further: to search for particular floods, to examine seasonal patterns, or to show other features of surface water variability, and at various map scales and projections. The most-recent observed water is accumulated as 14 daily water files: to remove nearly all cloud obscuration. Thus, today's map includes 14 days of data. Following are the links to GIS data directories; these are also provided at the page for each individual map sheet. In 2013, DFO is transferring many GIS files in its holdings to these public locations.
http://floodobservatory.colorado.edu/Version3/070E030Nv3.htmlhttp://floodobservatory.colorado.edu/Version3/070E030Nv3.html Located here (change upper left corner degree coordinates as appropriate) is access to the archived long term record for each map sheet. The GIS file names include their associated dates. Choose appropriate dates to retrieve surface water changes during particular floods or droughts. Or retrieve the yearly .ppt slide compilation, when available, from that directory, and scroll through time. In April 2013, automated updating is being implemented. This uses .shp (and associated files) named "current" in the MODISlance_2wkpro directory: http://csdms.colorado.edu/pub/flood_observatory/MODISlance_2wkpro/ Theses .shp files are 14 day accumulations. http://csdms.colorado.edu/pub/flood_observatory/MODISlance/ Located here is access to the automated daily .shp file GIS record (record commences in 2011). Choose map sheet directory and appropriate dates to retrieve surface water changes during particular floods or droughts. The end user can also accumulate files over any chosen interval. DFO uses only the three day .shp file product, commencing January 1, 2013, as the two day .shp files include abundant cloud shadow noise for some map sheets.
See also NRT Global MODIS Flood Mapping from NASA http://oas.gsfc.nasa.gov/floodmap/home.html and technical information about the Record, including hints for importing the maps into GIS http://floodobservatory.colorado.edu/TheSurfaceWaterSurvey.html With citation of the source, this “Guidebook” and all map displays and associated GIS data can be further distributed and used under the Creative Commons Attribution 3.0 Unported License: http://creativecommons.org/licenses/by/3.0/