Download
1 / 22
220 likes | 326 Views
US Renewable Energy Markets: Financial Perspective. By Michael D. Ware Advance Capital Markets, Inc. Washington Council of Governments Washington, DC June 22, 2005. “The way we produce and consume energy hasn’t changed much in decades.” Business Week October 11, 2004. Overview.

E N D
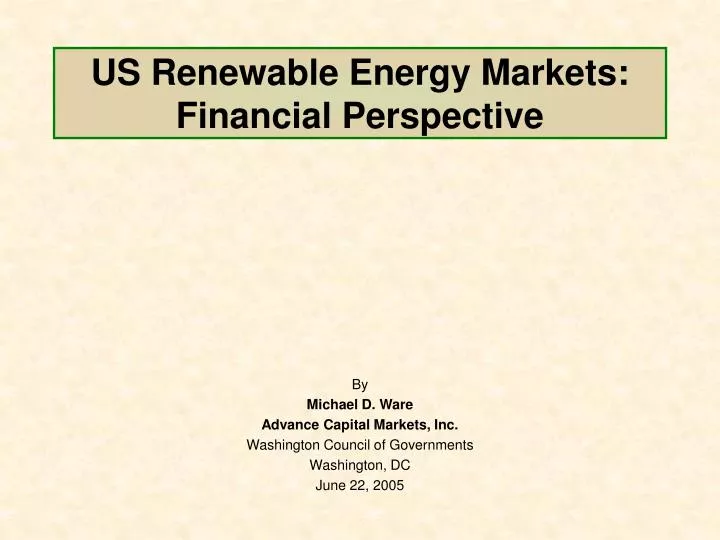
US Renewable Energy Markets: Financial Perspective By Michael D. Ware Advance Capital Markets, Inc. Washington Council of Governments Washington, DC June 22, 2005
“The way we produce and consume energy hasn’t changed much in decades.” Business Week October 11, 2004
Overview • Financial Markets for RE are Driven by Key Factors • Economic • Financial • Political • Review of RE in the U.S. • Potential Local Applications
Solar <1% Geothermal 4.5% Biomass 45.5% Wind 2% Hydroelectric 47% U.S. Energy Consumption by Fuel 2003 Source: AEO 2005 tables (released in December 2004) based on US energy consumption. Overall breakdown Table A1 (Total Energy Supply and Disposition), and Renewable breakdown Table A17 (Renewable Energy, Consumption by Section and Source). Source: NREL
Economic Factors • Rise in Crude Oil Prices • $30.00 BBL to $54.00 BBL • Tight US Natural Gas Supply • Natural Gas Prices Remain High • Cheap Coal Power Becoming More Expensive • On and Off Peak
Financial Factors • Overhang of Merchant Power Plant Debt • Financial Condition of Electric Utilities • Larger Players Entering the RE Market • AES • PPM • Goldman Sachs • “New” Financing Sources Available for RE
Political Factors • Quest for “Energy Independence” Hides Practical Solutions • On/Off PTC has Retarded Growth in the Wind Industry • States are Taking the Lead • Enacting Renewable Portfolio Standards (RPS) • Western Governor’s Association: 1,000 MW CSP Initiative
Significance of the Factors on RE Markets • High Oil and Gas Prices Make RE Options More Economic • Wind Power is Competitive with Gas Fired Generation • Convergence of Costs for all Energy Technologies • Growing Realization Among US Industry Leaders that RE must be a Significant Part of US Energy Policy • Regional vs. National Markets
Resource Potential Renewable Energy in America- Regional Resources, Economics and Politics - SOLAR ENERGY WIND POWER GEOTHERMAL BIOMASS
U.S. Wind Energy Source: AWEA
Global PV Installations Source: IEA Photovoltaic Power Systems Programme
U.S. Geothermal Energy Source: Geothermal Energy Association
Biomass Installation by Fuel “PURPA Market” Source: USDOE
Fuel Ethanol Production Source: Renewable Fuel Association
Key Trends in Financial Markets • More VC Firms Investing in RE Technology • Private Equity Investments in Solar and Wind • Equity Investors Driven by Tax Credits for Wind and CSP • New Investors in Renewable Fuels • Increasing Interest in Hybrid and Off -Grid Applications • States and Local Governments making Funds Available for RE • E.g. Mass Renewable Energy Trust
Phase I: “Development” RD&D Technologies: Wind Solar Hydro Geothermal Ocean Biomass Biofuels Commercialization Phase II: “Utilization” National Needs Solutions: National energy supply National security Environment Climate change Economic growth Investment opportunities Jobs Market Adoption ACORE Call for “Phase II”
Potential RE Options • Solar PV Programs • Residential • Commercial • Bus Shelter/Traffic/Signage • Solar Thermal Programs • Domestic Hot Water • Wind Power (REC) Purchases • Emergency Power Programs • Solar PV/Hybrid • Biogas/Fuel Cell Hybrids • Hybrid Car Programs
Petroleum Supply, Consumption, and Imports, 1970-2025 (million barrels per day) 30 History Projections 25 20 70% Consumption Net imports 15 54% 10 Domestic supply 5 0 2025 1970 1980 1990 2000 2010
Primary Driver of Increased Consumption • Power sector consumption of natural gas projected to increase significantly every year: Source: Energy Ventures Group
National Security Petroleum supply, consumption, and imports, 1970-2025 (million barrels per day) Source: DOE/EIA-0383(2003) Annual Energy Outlook