Download
1 / 35
350 likes | 354 Views
Explore the concept of social justice in relation to aging populations. This conference highlights different approaches and policies in various countries, focusing on the fair distribution of resources and well-being for seniors. Learn about the challenges and opportunities in housing, health, institutions, and services for older individuals. Gain insights into the phases of population aging and the role of government, NGOs, and the private sector in providing support to seniors.

E N D
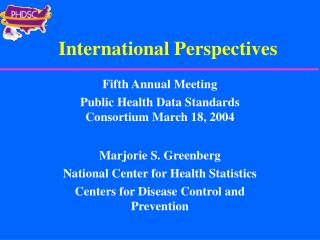
Social justice and aging populations International perspectives NZCCSS Conference Napier, New Zealand April 10-11, 2008 Satya Brink, Ph.D. Brinks@attglobal.net
Social justice means that every one contributes fairly and has fair access to the resources of society for individual and societal well being • Between people within the population - similar standards of living • Over the life course - fair distribution over different stages of life • Between generations - fair distribution of contributions and resources
All countries share some features • Seniors have primary responsibility for themselves but their needs increase with age. • Family members continue to provide most of the care and services. • Seniors prefer to live independently at home. • Low income seniors tend to have poorer health and more disabilities. • Health care at the end of life can be a major expense. But countries cluster into 3 phases based on how they respond to the aging of their population
In 1901, the population of New Zealand by age formed a typical pyramid. There were far more children than seniors over 65 First Old Age Pension Act in 1898
50 years later, about 7-10% of the New Zealand population was aged 65 and over: Phase I. Population 2m Phase I was when most aging policies were implemented. Social Security Act 1938 and National Health Service
By 2005, the cohorts of children had shrunk; the cohorts of elderly grew. 11 to 14% were seniors. Phase II • More people live alone • More grand parents than grand children • Grandmothers still have their parents – children could have parents for 50 years • Elderly are healthier • Retirement years equal working years • Children aged sixty are caring for parents aged 85
Life expectancy has progressively grown in New Zealand. It is now 76 years for men and 81 years for women
The population 65 and over in New Zealand will double between 2005 and 2050 and a high proportion will be over 80 years old. Moving to Phase III. Over 15% aged 65 and over Total population: 4m Median age: 33 The New Zealand Superannuation Fund (Fund) was created by an Act of Parliament in 2001.
Total population: 5.05m Median age: 46
How housing and services are provided in the three phases Phase 1 7-10% are 65+ in the population.Most older people (7-9%) who need care live in nursing homes. Few services available for those living at home. 11-14% are 65+ in the population.High cost discourages nursing home care (5-6%). Policies for aging-in-place result in many forms of residential care. Low use of home care. Over 15% are 65+ in the population.Integrated systems to provide care depending on need of the older person. Blurring of forms. Most people receive home care. Housing quality retained. Few people in nursing homes, for shorter periods, mostly at the end of life. Phase 2 Phase 3
PHASE 1 EXAMPLES: INDIA, KENYA • Growing life expectancy, more older people. • Less co-residence of two generations. • Increasing interest in barrier-free design in housing, communities and transportation • Growth in the number of geriatricians. • Build institutions (nursing homes, geriatric hospitals) for persons who need housing and care. • Voluntary organizations start to provide services.
PHASE 2 EXAMPLES: UNITED STATES, CANADA • Increasing proportion of seniors; Need high and fast investment in housing, services and care. • Growing number of seniors living alone. • Proliferation of housing with care and services but small stock, generally private or non-profit. • Fewer persons living in institutions. • Aging-in-place but insufficient support system. • Growth in public, private and non-profit services.
PHASE 3 EXAMPLES: NETHERLANDS, SWEDEN • High proportion of seniors with better health and declining rates of disability. • A life cycle approach used for an integrated system, with blurring of forms and levels. • Improve housing stock and services for aging-in-place. • Less time spent in institutions through better care at the lower levels. • More consumer choice and shared decision making in care and services.
What we know... HOUSING: It will not be possible to build enough special housing for seniors and build them in the right places when one in five is aged 65 and over. The housing stock must be life span housing. Special housing will serve those who need it. The elderly expect to have the same quality of housing (space, amenities) as others. HEALTH: Improved health from 0-65 years reduces illness and disability after age 65. INSTITUTIONS: Good quality housing and lower levels of care will delay the move and reduce the time spent in expensive institutional care. SERVICES: The needs are diverse and changing, therefore, customized packages work the best.
Mixed models of provision used with success PUBLIC:PENSIONS INCOME SECURITY HEALTH INSURANCE PRIVATE: HOUSING HEALTH INSURANCE PENSIONS SOCIAL SUPPORT NGOs: HOUSING/SERVICES (Non-Profit) SUPPORT SERVICES SENIORS USUALLY HAVE TO PUT THEIR OWN PACKAGE TOGETHER
The elderly are multi-intervention clients. When the interventions for housing, services and health care change at different rates, each should be directedto the client and not be tied to housing 80+ 25-65 65-80 Independence Disability threshold FUNCTIONAL CAPACITY
Maintaining independence and functional capacity late in life 80+ 25-65 65-80 Independence Disability threshold FUNCTIONAL CAPACITY HOUSING MODIFICATION Most supportive or special housing forms were designed for seniors at this stage when they were more functionally able and when there was less diversity of need and use of services.
Maintaining independence and functional capacity late in life 80+ 25-65 65-80 Independence Disability threshold FUNCTIONAL CAPACITY HOUSING MODIFICATION CARE & SUPPORT SERVICES Once housing is properly modified no further changes are required. Or lifespan accommodates people over the life course. But the need for services changes enormously - type, number of services, frequency.
CARE AND SERVICES DELINKED FROM HOUSING • Seniors with the same needs enjoy the same services regardless of type of housing. • The needs of seniors 80 and over are very diverse: offer customization rather than standard service packages. • Services consumed over many years, changing with need. • Services needed by seniors are delivered by a variety of trained professionals at different rates – only very large support housing with staff can accommodate this. • Most seniors are happy in their homes, often owned mortgage free. Prefer to add services, rather than purchase housing plus services. • Cohorts of seniors now different from 20 years ago - life styles, rising life expectancy free of disabilities, higher expectations.
Most older New Zealanders own their homes and do so until late in life • Over 80% own or partly owned their homes until age 75. • The major drop to 60% in ownership is at age 80. • The preference for ownership is unlikely to change for the aging cohorts. • The living standard and independence will continue to be highly valued.
Social justice principle and aging – International Experience Sweden: 17.3 over 65 and 5.3% of population aged over 80. Adult children have neither financial or caregiver obligations for their parents but are welcome to provide support. Care by trained people is better for seniors. 94% live in their own homes, with or without home care, 3% live in special purpose housing and 2% in nursing homes. Norway has Life Span Standard for housing, Denmark: The type of housing should not determine the care and services to which people are entitled. This is true also for dependent elderly people. They have their own address and a rental lease and secure tenure. Special housing has the same minimum standard for space and amenities as general housing - an independent self contained unit, with living room, bedroom, kitchen, bathroom; up to 67 m2. Nursing homes use has been reduced. Services can be chosen from public, private or non profit providers. Netherlands: Care-to-measure concept resulted in: “client-linked budget” where clients can choose the services and the provider and pay for them. Japan: Forty percent of the housing stock to be designed for aging in place by 2015 - half from new construction and half through renovation.
Preparing for the peak growth in 2031 for persons 65 and over • The largest increases in the 65+ age group will occur in the decades 2021 and 2031. • The percentage of elderly will double between 2006 and 2036 attaining 24% of the population (1,188,000) following which there is gain of 3 percentage points over the next 25 years. • New Zealand should be careful not to overbuild but to build in flexibility for changing rates of growth of the elderly population. Increase in population aged 65+, New Zealand. (Series 5) Statistics New Zealand
Care services have to be provided in a more efficient yet satisfactory way because the numbers of older elderly and elderly living alone are growing A simple shift between formal and informal caregivers will not work NZ statistics, population projection, series, base 2006
A higher rate of growth among those 85+ will pose challenges • Nursing home residents are generally 85 and over. The time spent in nursing homes, at the end of life, is dropping. • New Zealand currently has over 30,000 people with dementia and that number will more than double by the year 2040. Dementia and Alzheimer's occurs more among those in their 80s. Growth in percent of the population 65 and over by age cohorts, New Zealand
Will New Zealand be a great place to age? • NZ has about 10 years to be ready for the seniors boom that will peak in 2036. • The “made for NZ” solutions must be flexible to accommodate the decreased growth after the peak. • Voter and consumer power exercised by older people – 25% of the voters. And they vote! It is up to you!