Download

1 / 28
280 likes | 423 Views
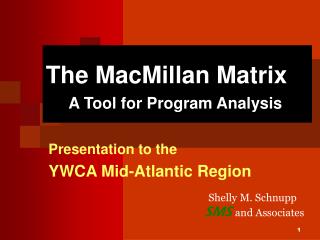
Applications of Multilevel Analysis in Program and Policy Evaluation: Benefits and Challenges. November 2, 2006 American Evaluation Association Annual Conference Portland, OR. Presentations.

E N D
Applications of Multilevel Analysis in Program and Policy Evaluation: Benefits and Challenges November 2, 2006 American Evaluation Association Annual Conference Portland, OR
Presentations • Predicting Substance Abuse Treatment Completion from Individual, Program, and County Characteristics Using Multilevel Modeling and Geographic Information Systems (GIS) – Furrer & Chase • Do School Characteristics Influence Adolescents' Health Behaviors? – Marchand, Furrer, & Brekhus • Characteristics of Successful Mental Health Consultants: A Multilevel Analysis of Head Start Programs - Green & Everhart
Multilevel Modeling: A Conceptual Overview The case of nested data
County Program 02 Program 04 Client 1 Client 5 Client 2 Client 6 Client 3 Client 7 Client 4 Client 8 What is nested data?
Why nested data is an analytical challenge:independent observations Creatures that exist within a particular unit tend to be more similar than creatures randomly selected from the general population due to: • Selection • Shared environment
Common Approaches to Nested Data • Ignore the “nestedness” of the data • Disaggregate data to lower level • Aggregate data to higher level
Why Common Approaches Are Less Desirable • Ignoring “nestedness” increases likelihood of under-estimating standard errors • Disaggregating violates assumption of independence • Aggregating attenuates lower level variation • Cannot assess individual vs. group variation
Basic Hierarchical Equations Level 1 Outcomeij = B0j + B1j(var1ij) + errorij Level 2 B0j = g00 + g10(var2j) + error0j B1j = g10 + g11(var2j) + error1j i = individual, j = group
Within Group Variation Program 1 Average relationship between tx hours & MHI scores MHI Scores x x x x x x x x x x x x x x x x x x Program 1 average MHI score x x # Treatment Hours
Program 1 Program 2 Variation Components x x x x x x x Grand Mean x x x x x x MHI Scores x x x x x x x x x x x x x x x x x # Treatment Hours
Between Group Variation Average relationship between tx hours & MHI scores Average MHI Scores x x x x x x x x x x x x x x x x x Overall average MHI Score (grand mean) x x Program’s Avg # Treatment Hours
Goals of Today’s Presentations • Account for variation in an individual-level outcome due to group membership • Predict individual outcomes based on group-level characteristics • Illustrate the differences between using a disaggregated approach and a multilevel modeling approach
Predicting Substance Abuse Treatment Completion from Individual, Program, and County Characteristics Using Multilevel Modeling and GIS Carrie Furrer, NPC Research John Chase, Cascadia Geospatial Portland, OR
Research Questions • Do program-level characteristics predict treatment completion rates beyond individual characteristics? • Do county-level characteristics predict treatment completion rates beyond individual characteristics? proportion of completed treatment episodes
Provider 001 County 01 Client 1 Client 5 Client 2 Client 6 Client 3 Client 7 Client 4 Client 8 Models • 2 LEVELS: • Individuals nested within 138 programs • Individuals nested within 33 counties
Sample Demographics • 46,230 Oregonians in public A&D treatment sometime during 2000 • Ethnicity • 79% Caucasian • 11% Hispanic • 5% Native American/American Indian • 4% African American • 1% other
Sample Demographics • 72% Male • 55% Employed (part- or full-time) • 27% Married • 78% HS or less • Drug of choice • 64% Alcohol • 15% Methamphetamine • 11% Marijuana
Program-Level Predictors Aggregated CPMS Data (individual-level) • Average client frequency of use • Type of treatment provided (proportion of residential treatment episodes)
Variance Accounted for by Individual- & Program-Level Predictors • Program – 24% • Demographic Characteristics – 3% • A&D Treatment Characteristics – 14% • Program Characteristics – 5%
Interpretation: Program Level • Severity of substance use, as indexed by frequency of use, is both a client- and provider-level predictor of treatment completion. • Clients served by providers that dealt with more severe substance abuse issues tended to have lower completion rates regardless of their own severity.
County-Level Predictors US Census Data • Single:Married Household Ratio • Unemployment Rate in 2000 • Median Household Income
Variance Accounted for by Individual- & County-Level Predictors • County – 2% • Demographic Characteristics – 7% • A&D Treatment Characteristics – 17% • County Characteristics – < 1%
Interpretation: County Level • Marital status is both a client- and county-level predictor of treatment completion. • Individuals who lived in counties with a larger proportion of married households, regardless of whether or not they were married, tended to have better completion rates.
Conclusion • THINK CONTEXT. Contextual features, especially at the provider level, have important influences on individual treatment outcomes. • ANALYZE CONTEXTUAL FEATURES CORRECTLY. A multilevel approach estimates nested effects more accurately than a disaggregated approach.