Download
1 / 36
390 likes | 555 Views
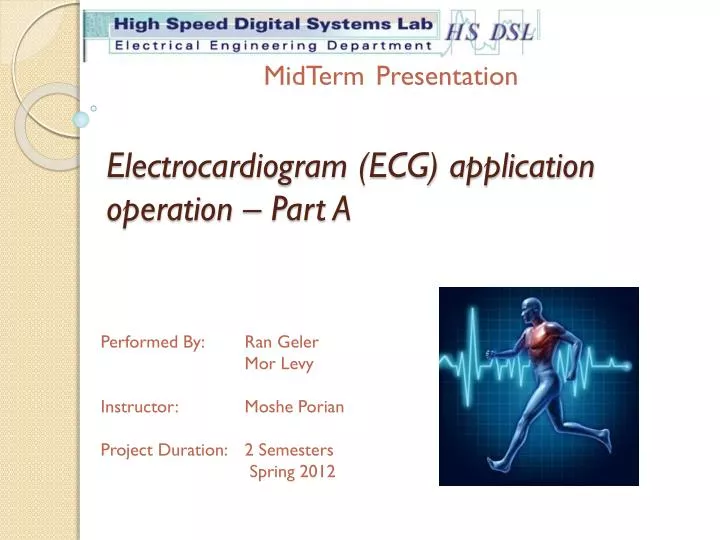
Electrocardiogram (ECG) application operation – Part A. MidTerm Presentation. Performed By: Ran Geler Mor Levy Instructor: Moshe Porian Project Duration: 2 Semesters Spring 2012. Contents. Intro Top Architecture Overview Data Flow Components Simulations

E N D
Electrocardiogram (ECG) application operation – Part A MidTermPresentation Performed By: Ran Geler Mor Levy Instructor: Moshe Porian Project Duration: 2 Semesters Spring 2012
Contents • Intro • Top Architecture • Overview • Data Flow • Components • Simulations • Problems in developing process • Conclusions • What’s next • Schedule
Intro • The heart is a muscular organ that beats in rhythm to pump blood through the body • By analyzing the heart behavior and especially the electrical impulses we can help identify heart diseases and special circumstance that require close monitoring
Medical Terms • ECG • Lead • Bipolar leads • Unipolar leads • Precordial Leads
Project Goals • Portable ECG device based on FPGA • Integrating Multi Platforms elements • ECG DB with FPGA • Interactive GUI with debugger abilities • Methodic project
Overview • Acquaintances with other projects components • SPI, Wishbone, RX/TX path, FIFO, Flash • Implemented ECG controller • ECG FSM • Assimilation of SPI core & FIFO • Examination of the Implemented components
Top Architecture – Frequency Frequency requirements for modules MATLAB GUI: Rx / Tx Via UART interface @ frequency of 115,200Hz FPGA: Main frequency: 100MHz Rx / Tx Modules @ frequency of 115,200Hz ADS1928R: Main frequency: 2.048MHz SPI-Data Out freq’: >110KHz Flash Memory: Main frequency: 100MHz
Core microarchitecture Data Rate: 100MHz 512Bytes Data Rate: >110KHz
Core Architecture • ECG FSM • FIFO • Command & Aux Regs • Wishbone Master & Slave • SPI Core
ECG FSM • Controls the flow of data between the host and the DB • Three Main chain of actions: • Read Data • Read Registers • Write Registers
FIFO at ECG Controller • FIFO Size: 512 Bytes. • Stores Instruction and Sampled data. • Data structure on Instruction case: 1st Command 2nd Command Operation Commands (ex: RDATAC, Rreg, Wreg, Standby, Reset, ect’..) Additional Data Optional: Second Byte for (Rreg, Wreg) and sample interval for RDATAC command. Data for commands
SPI • The SPI Interface frequency: • At 24bit resolution per 8 Electrodes and 500 Samples per Sec: • Active at low. i.e. CS = ‘0’
Flash Component WBS Flash Component FLASH Flash FSM Flash Controller RAM 256Byte Reset en
Flash Component - Flash • One sample(24bit res. per 8 Electrodes)= 27Byte. • Lets assume sample rate of 500 SPS • Flash size = 4MB • Therefore we can sample for 5min.
Flash Component – Flash client BUS Technical Demands: • Common FLASH Interface protocol (CFI) • Wishbone Interface • Performs Read, Write, Reset and Erase transactions • Initiative read on power-on • Contains a timeout algorithm • Generic: adaptable to different FLASH sizes and clock frequencies. CFI Wishbone
ADS1298R ECG DB • Texas Instruments Card • Arrived to the High Speed Digital Systems Lab
ADS1298R ECG DB • Future acquisitions of probes and electrodes • Connection of the DB to the FPGA
Test Methodologies • Operation of the ECG Controller: • Checking that states change are at time • Checking control signals & data signals between units • Non existing commands • NOTE: When a transaction is executed the wishbone “stall” signal is raised to ‘High’, So other requests will remain pending at the Rx Wishbone Master.
ECG Controller TB Data Flow • We have implemented a special closed component for Testing.
Simulations – Read mode • ECG Controller Unit actions • Reading samples from DB – RDATAC command SPI Received data 25Bytes Bytes 15
Simulations – Read registers • Read n nnnnregisters starting at address r rrrr(001r rrrr, 000n nnnn) • RRegcmd(0x2C): read 5 register from address 12. FSM St. SPI MOSI SPI MISO FIFO DIN FIFO DOUT
Simulations – Read registers • Wishbone protocol END trans. BUS Req. Send data
Simulations – Write registers • Write n nnnnregisters starting at address r rrrr(001r rrrr, 000n nnnn) • WRegcmd(0x49): write 5 register from address 9 FSM St. SPI MOSI
Simulations – Write registers • ReceivedData at Remote SPI Slave SPI MOSI SPI Data out
Simulations - DB • Entering Standby & then Wakeup • Wake-up from standby mode (0x02). • Enter standby mode (0x04). Return to idle Standby 0x04 Wakeup 0x02
Problems in developing process • Lack of VHDL writing techniques • Understanding imported components • Absences of decisiveness on one developing method
Conclusions • We learned a lot about the developing process & the importance of good planning a head
What’s Next • Combining RX\TX path, ECG controller and Flash component into Main VHDL component • Connecting the DB to the FPGA • Building test environment for testing the Data flow from the electrodes throw the DB & FPGA to the MATLAB • Building the GUI
Schedule – Semester A remain work 6.1 13.1 20.1
Schedule – Semester B 3w 3w 2w