Download
1 / 32
320 likes | 475 Views
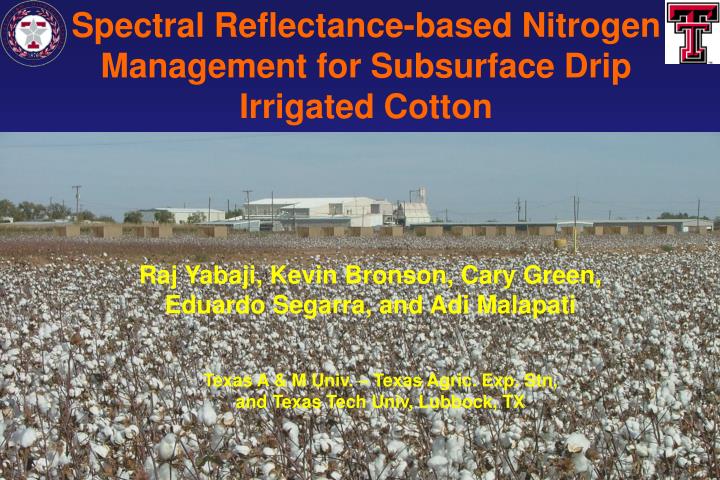
Spectral Reflectance-based Nitrogen Management for Subsurface Drip Irrigated Cotton. Raj Yabaji, Kevin Bronson, Cary Green, Eduardo Segarra, and Adi Malapati. Texas A & M Univ. – Texas Agric. Exp. Stn, and Texas Tech Univ, Lubbock, TX. Introduction.

E N D
Spectral Reflectance-based Nitrogen Management for Subsurface Drip Irrigated Cotton Raj Yabaji, Kevin Bronson, Cary Green, Eduardo Segarra, and Adi Malapati Texas A & M Univ. – Texas Agric. Exp. Stn, and Texas Tech Univ, Lubbock, TX
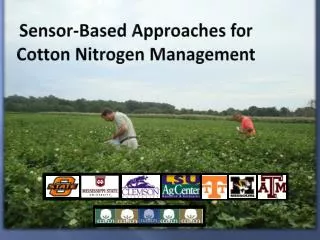
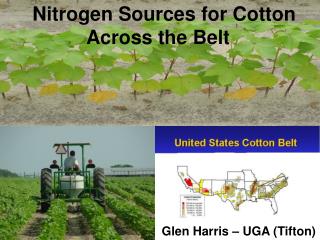
Introduction • The Southern High Plains of Texas average 3000-4000 ft in elevation, 18 in. rainfall/yr and 80 in. open pan evaporation/yr. • The densest concentration of cotton production in the world is here. 3 to 4 million ac of cotton are planted each yr. Cotton is mono-cropped. • Half of the cotton acreage is dryland, half is irrigated from the declining Ogallala aquifer. % 70 of the irrigation is center pivot, 25 % is furrow-irrigated, & 5 % is subsurface drip.
Objectives • Test spectral reflectance as an N management guide for SDI cotton • Refine the window of N fertilizer injection in SDI cotton • Compare 32-0-0 with 28-0-05S as N fertilizer sources in SDI cotton • Measure denitrification in SDI cotton as affected by N management
Plot plan 8, 40-in rows 600 ft
Treatments • 32-0-0 or 28-0-0 5S injected early bloom to mid bloom (5 weeks) • 32-0-0 or 28-0-0 5S injected early bloom to peak bloom (8 weeks) • Zero-N (1 plot/station/rep) • Reflectance-based mgt: 0.5 X N early to peak bloom, N injection rate adjusted upwards by 100 % when • GVI (Green vegetative index)reflectance/GVI soil test < 0.95 or statistical significance. • Amount of N fertilizer = 150 lb N/ac (for 2.5 bale/ac) – 0-24 in soil test NO3-N – irrigation water NO3
Nitrogen requirements for high-yielding cotton 1Nitrogen fertilizer plus 0-24 inch NO3-N
Passive sensor (natural light) 16 wavebands (up & down) 48 inches above canopy Within 2 hrs solar noon Percent reflectance = Refltd irrad @ λ / Incoming irrad @ λ Cropscan MSR 16
Vegetative indices(Bausch and Duke, 1996) • Green vegetative index = R820/R550 • Red vegetative index = R820/R650 R = percent reflectance at λ (nm)
Spring soil nitrate, N fertilizer amounts injected, well water nitrate, and total N supply, Lubbock, TX, 2005
Spring soil nitrate, N fertilizer amounts injected, well water nitrate, and total N supply, Lubbock, TX, 2006
Correlations of Green vegetative index (GVI), chlorophyll meter (SPAD) readings, leaf N, biomass and lint yield, SDI cotton Lubbock 2005-6
Correlations with chlorophyll meter (SPAD) and spectral reflectance at early bloom Lamesa, 2003 Means: Biomass – 704 kg/ha, Leaf N – 3.9%, NDVI_cropscn – 0.43, NDVI_grnskr – 0.52
Correlations with chlorophyll meter (SPAD) and spectral reflectance at early bloom Lamesa, 2004 Leaf N SPAD NDVI_cropscan NDVI_green skr 550nm 0.21 Biomass 0.30 0.34 - 0.29 Leaf N 0.53 0.52 0.43 -0.32 SPAD - 0.30 NDVI_crops 0.47 - 0.31 NDVI_grnsk Cropscn_550 Means: Biomass – 1954 kg/ha, Leaf N – 3.7%, NDVI_cropscn – 0.73, NDVI_grnskr – 0.86
Mid-bloom biomass, green vegetative index, chlorophyll meter readings as affected by N management, Lubbock, TX, 2005
Mid-bloom biomass, green vegetative index, chlorophyll meter readings as affected by N management, Lubbock, TX, 2006
First open boll biomass, N uptake, seed and lint yields as affected by N management, Lubbock, TX, 2005
First open boll biomass, N uptake, seed and lint yields as affected by N management, Lubbock, TX, 2006
Recovery efficiency of 90 lb fertilizer-N/ac in cotton plants
Summary • Green vegetative index related to leaf N and biomass, and responded to N fertilizer treatments. GVI reflected net N mineralization in zero-N plot. • We tested spectral reflectance-based N management, i.e. initial N injections of ½ X of soil test recommendations, and adjusting upwards as GVI falls significantly below soil test management for 2 ½ bale/ac yield goal. • Spectral-reflectance N injection saved 28 and 15 % N compared to soil test-based management for 2005 and 2006, respectively.
Summary cont. • Recovery efficiency of N fertilizer injected daily in subsurface drip irrigated cotton is high, i.e. 62-75 % • Denitrification from N fertilizer injections in SDI cotton was not detectable.