Download
1 / 16
160 likes | 450 Views
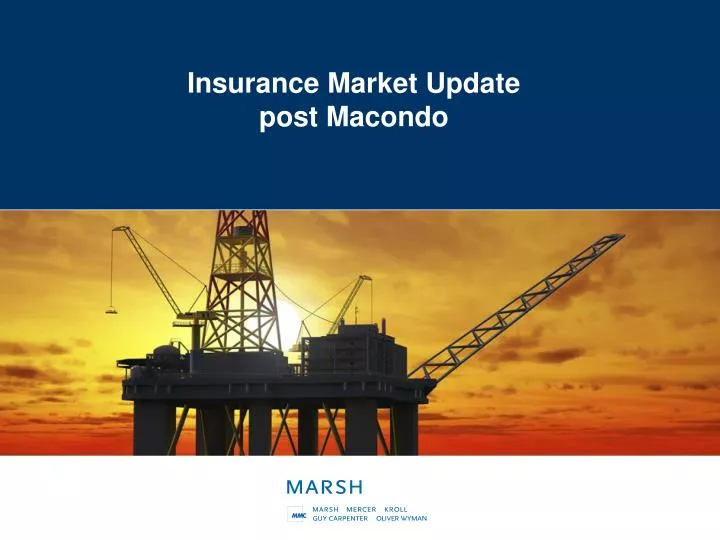
Insurance Market Update post Macondo. The Macondo Loss – April 20, 2010. The largest accidental marine oil spill in the history of the petroleum industry 11 fatalities 17 Injuries 4.9 million barrels of crude released 62,000 barrels per day estimated max discharge rate

E N D
The Macondo Loss – April 20, 2010 • The largest accidental marine oil spill in the history of the petroleum industry • 11 fatalities • 17 Injuries • 4.9 million barrels of crude released • 62,000 barrels per day estimated max discharge rate • Well was effectively “killed” onSeptember 19, 2010 – 5 months after the original incident Photo: US Coast Guard
Oil Spill Extent NASA image taken on May 24, 2010 – Spill estimated to cover an area in excess of 4000 square miles
Operating Group for Macondo Joint Venture The cost of the response to September 29th amounts to approximately $11.2 billion, including the cost of the spill response, containment, relief well drilling, static kill and cementing, grants to the Gulf states, claims paid and federal costs. (1) Combined $80 billion reduction in Market Cap of the companies directly involved (as at September 30th) (2) (1) Source: BP PLC (2) BP, Transocean, Anadarko, Mitsui
Insurance Coverage in Place for the Key Players • BP:With a 65% interest in the Deepwater Horizon joint venture, BP says it is self-insured. BP’s captive (Jupiter Insurance Ltd) has $6 billion in capital. It is reported that Jupiter’s per occurrence limit on physical damage and business interruption is $700 million and is not expected to cover environmental clean-up costs or third party liability. • Anadarko Petroleum: With a 25% interest in the Deepwater Horizon joint venture, Anadarko Petroleum publicly stated they have $162.5M in available COW and Liability limits • Mitsui Oil Exploration: With a 10% interest in the Deepwater Horizon joint venture, Mitsui is believed to have a $175 million of coverage available. • Transocean: The Deepwater Horizon was insured for $560 million. In addition, Transocean carries some $950 million in third party liability insurance. • Cameron: The manufacturer of the blowout preventer that failed on the rig reportedly has a $500 million liability insurance policy. • Halliburton: Service provider to Deepwater Horizon reportedly has liability insurance in excess of $1 billion. Source: Barclays Capital research note 05/10/10; Credit Suisse research note 5/11/10
But how much will the market actually pay? • BP has said it will assume liability for all legitimate claims caused by the oil spill. Primary liability for clean up costs will be BP and its partners. • Transocean has already been paid the majority of the claim for the Deepwater Horizon. • The Energy Market will likely pay somewhere between $1.2 and $2.5 billion in claims • Litigation, D&O liability and workers comp losses will add to the loss total but will likely take many years to finalize • Lawsuits against equipment manufacturers, suppliers and sub-contractors will also add to the claims – even to the extent of defense costs. • The $20 billion fund established by BP could reduce the chances for large liability awards. Source: Insurance Information Institute (I.I.I.) 9/1/10; Towers Watson, 08/02/10; Bank of America Merrill Lynch research note 08/20/10; Barclays Capital research note 05/10/10; Credit Suisse research note 05/11/10
But it is more complicated than that….. • Other types of claims likely to be filed: • Personal injury claims on behalf of families of persons suffering injury or death in initial platform explosion • Products liability and/or negligence claims against equipment manufacturers, suppliers etc. • Natural resource damage claims from states (water, air, seashore) • Claims by businesses and individuals for lost earnings and/or property damage, (e.g. fishermen, shrimpers, resort operators, excursion boat operators, casino operators, hotels, restaurateurs.) • Claims alleging lost revenues at the govt. level, (e.g. royalties, lease payments, fishing licenses, sales taxes) • Environmental claims (e.g. on behalf of conservationists and fishermen) • Health claims by workers assisting with cleanup (e.g. occupational injury due to use of dispersants) and coastal residents Source: Credit Suisse Research Note 05/11/10; Insurance Information Institute (I.I.I.) 9/1/10
So what does the Macondo loss mean for buyers in the Commercial Market? • Initial Reaction Post April 20th • Other Market Losses • 2010 Windstorm Season • Reinsurance Renewals • Other Impacts of Macondo • The Competitive Landscape • 2011 Challenges
Initial reaction post Macondo • As expected the market “over reacted” • 1st deepwater well was drilled in 1980 • Over 2100 deepwater GOM wells have been drilled since without incident • Control of Well rates in deepwater immediately increased over 100% • Capacity also being closely looked at • GOM Rig physical damage rates increased by more than 20% • Liability rates for deepwater operators increased by more than 25% • Bermuda markets became reluctant players at attachment points of less than $500M • Casualty insurers started enquiring about the limits purchased for COW and in some cases wanted this information noted on the policy.
Other Recent Market Losses • “Alban Pearl” – sank May 13th – Market Loss $235 million approx. (1) • Apache – additional IKE claim for LOPI presented to the market in May – estimate $150 million (1) • Enbridge – July 27th, Kalamazoo Oil Spill - $350 million (2) • PG&E – September 9th, San Bruno Pipeline Explosion - $ ????? (1) Willis Energy Market report (2) Enbridge Energy Partners LP
2010 Windstorm Season • Forecasters were predicting a very active season with anywhere between 15 and 23 named storms, 8 – 14 hurricanes and 3 – 7 major hurricanes (cat 3 and above) • CSU estimated a 76% chance of a major hurricane hitting the US Coast • As of October 14th there have been 16 named storms, 9 hurricanes and 5 major hurricanes • This is much close to an average year as opposed to a “very active year” • In addition, no hurricane actually made landfall in the USA, although Earl skirted the Eastern Seaboard as a Category 2 / 1 • But no losses to the Energy Market……
Reinsurance Renewals • Largest single insurance claim event in 2010 to the Reinsurance market was the Chilean Earthquake • Approx. $350 million to the Energy Market but; • $8 - $12 billion to the re / insurance market as a whole (1) • This did little to move the reinsurance market for renewals at July 1st other than in areas specifically affected by the losses (2) • Losses from the Energy Market may move prices higher but not dramatically (2) • Reinsurers may well require much greater detail on potential clash coverage between multiple assureds' and multiple coverages on a single exposure (2) (1) Insurance Journal Sept 2010 (2) Guy Carpenter July 2010 reinsurance review
Other Impacts of Macondo • US Deepwater Drilling Moratorium • New BOEMRE requirements for all OCS properties and drilling activity • Proposed changes to U.S. Oil Spill Legislation • Contractual Reviews • between Operators and Partners • between Operators and Contractors
The Competitive Landscape • Long term viability of Insurers requires adequate pricing, BUT • Supply and Demand weigh heavily into the equation • The majority of Deepwater GOM operators are either self insured or a member of OIL • There is still more than enough capacity in the Energy Market for all but the very largest of risks • There is evidence of some premium increases on offshore renewals – but nothing dramatic • There is no indication from Reinsurers (yet) that capacity for 2011 will reduce dramatically or that prices will increase significantly • Underwriters have had a further year without GOM windstorm losses
2011 Potential Challenges • What effect with the EU Solvency “2” directive have on the capacity offered by European Underwriters (including Lloyd’s)? • Will the reinsurance market for Energy Business actually harden? • How much influence will the Lloyd’s franchise board have on the business plans of each Underwriting Syndicate or Company? • What will the revisions to OPA 90 mean to operators? • Increased COFR limits? • Necessity of increased liability levels to meet regulations? • How will the market respond to these? 2011 will be a challenging year for both the Energy Industry and Insurers