Download
1 / 28
280 likes | 423 Views
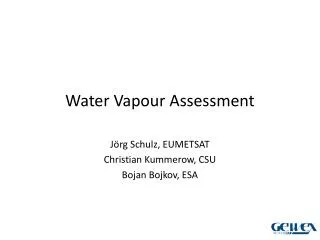
Requirement for Adequate Water Assessment. Evaluation of current water use and costs associated with water supply and wastewater discharge. Development of a water balance that provides a detailed breakdown of water use by end-use/process.

E N D
Requirement for Adequate Water Assessment Evaluation of current water use and costs associated with water supply and wastewater discharge Development of a water balance that provides a detailed breakdown of water use by end-use/process Evaluation of efficiency opportunities and identification of life-cycle cost-effective measures The objective of water assessment is to develop an understanding of facility water consumption and identify cost-effective water efficiency measures that will help to achieve the site’s required water reductions Strategic plan for meeting water reduction goals.
Water Assessment Phases Phase I: Background Development and Preparation Historical water consumption analysis 1. Collect and analyze at least 2 years of data for total supply, wastewater discharge, and all sub-metered water data 2. Estimate system losses based on system condition and age, and document the method used for determining system losses 3. Develop annual distribution curve (water use over time) 4. Develop baselines for both potable water, and industrial, landscaping and agricultural (ILA) use, accounting for consumptive use from both potable and non-potable sources. Document the method used to develop the baseline. Cost data analysis 1. Calculate marginal cost of water and wastewater 2. Verify whether the facility is on proper water and wastewater rate schedules 3. Estimate the potential future water and wastewater rate escalation (to be used in life-cycle cost analysis of efficiency measures). Team coordination 1. Hold a kick-off meeting to state the goals and objectives of the assessment to the facility team 2. Provide interim progress reports on the preliminary findings of the audits 3. Hold a final meeting to present results of the assessment
For an Effective Background development Background data – The facility will provide background information to the assessment team for prioritization of the walk-through audits. This background data includes: 1. Historic water and wastewater bills or data from supply generated and/or treated onsite 2. Sub-metered data on water processes and buildings 3. Building floor space by building type 4. Occupancy data 5. Equipment lists 6. Maintenance schedules 7. Site and individual building maps 8. Distribution system maps
Phase II: Walk-Through Audits walk-through audits of buildings and applications that were identified in Phase I of the water assessment. The basic documentation requirements for water end-uses are described below: Scope :Only include end-uses and processes that pertain specifically to the site. 1. Domestic plumbing fixtures – Document the following items for toilets, urinals, faucets, and showerheads: Audit approximately 10% of the restrooms at the facility to obtain a gauge on the general age and condition of fixtures 2. Commercial kitchens – Document the following items for ice machines, dishwashing machines, tray conveyor systems, garbage disposals, pre-rinse spray valves, convection steamers, steam kettles and other water consuming appliances: Note the brand and model number of the appliance, measure the flow rate of the appliance if applicable, document the operating schedule of the appliance 3. Irrigation and landscaping : Measure system pressure, Note if there is an irrigation meter, document the operating schedule (noting time of day) and hours per day or week during irrigation season, document the irrigation technology type (make and model of equipment), Estimate the number of sprinkler heads , Identify the overall system condition, noting leaking/maladjusted heads , Identify controls (type of controls and how they are used) http://www.irrigation.org/Certification/CLIA/Audit_Requirements.aspx)
PHASE II: WALK-THROUGH AUDIT CONT’ 4. Evaporative cooling systems Determine the size of the system (this may be in terms of cooling tonnage or recirculation rate), Determine how many days the system operates per year C. Determine if make-up water is metered. If it is not metered, verify whether system water use is tracked by other means, If possible, walk the system to see if leaks or losses are apparent. For any leaks or losses found, measure and quantify the loss. 5. Closed-loop cooling systems Determine whether system losses are known and measured, If possible, inspect the system piping to see if leaks or losses are apparent. If leaks or losses are found, measure and quantify the loss. 6. Single-pass cooling Determine how many days the system operates monthly or annually, Determine flow rate of system. 7. Steam/boiler systems Determine the size of the system (this may be in terms of steam generation or boiler horsepower), determine how many days the system operates per year , Determine whether the make-up water is metered. If it is not metered, verify if the system water use is tracked by other meansDetermine if cycles of concentration are tracked routinely. If they are not tracked routinely, determine if there are operator logs available that include routine measurement of blowdown and make-up conductivity E. Determine whether the system blowdown is automated or done manually F. Verify that steam traps are operating properly and are leak free G. Determine whether the system returns condensate and where condensate losses may be occurring.
8. Hot water (closed-loop) heating systems Determine if system losses are known and measured If possible, inspect the system piping to see if leaks or losses are apparent. If any leaks or losses are found, measure and quantify the loss Assess domestic hot water heaters for temperature setting and possible leaks. 9. Laboratory and medical facilities – Document the following items for disinfection/sterilization systems, vacuum pumps, water purification systems, photographic and x-ray equipment, glassware washers, vivarium equipment, and other water-using equipment. Note the brand and model number of the equipment, Measure the flow rate of the equipment, if applicable 10. Laundry facilities Determine type of washing machines (note make and model number), Estimate the number of loads washed per day or week, Identify the overall condition of the equipment. 11. Vehicle wash stations Determine the type of wash station , Identify whether the system recycles water. 12. Alternate water sources investigation – Investigate opportunities to access alternate water sources for process on the facility premises to provide a high level recommendation including (but not limited to): [Note a detailed assessment of alternate water sources is outside the scope of a typical facility water assessment.] A. Rainwater harvesting , Grey water, Water reuse, Air conditioning condensate capture, Wastewater reclaim.
Phase III: Water Balance Development The contractor shall develop a water balance that provides water consumption by major end-use categories (as defined in the SOW in Phase II) and system losses. The contractor shall complete the following elements: Water balance – Develop a water balance that estimates current equipment and process water use by major end-use categories and system losses and compares this total to water supply and ultimate discharge or reclaim of wastewater 2. Graphical elements – Show water balance in graphical form in a flow chart and/or pie chart that breaks out water use by major end-use categories and estimated losses.
Sample Balance Water flow Winlet, T1 Water flow Winlet, T2 Water Flow Woutlet, R1 Water flow Winlet, T3 Recycled Water, W,recycle Using the Law of conservation of Matter Water Flow Woutlet, R2 Total Inflow rate of Water = Total Outflow rate of water + Total Water consumed within the system And for more detailed calculations, component or sub plant usage can be focused on
Phase IV: Water Efficiency Investigation and Economic Analysis Investigation and analysis of water efficiency opportunities that include the following elements: Efficiency opportunity assessment – Assess opportunities for water efficiency improvements in each major end-use, including technologies that are detailed above in Phase II of the assessment. Include a consideration for retrofit, replacement, operation and maintenance improvements, and applications for sub-metering 2. Alternate water sources identification – Identify alternate water sources to offset the use of freshwater sources and provide estimated potential of annual water volume, as well as potential applications where the alternate source could be utilized 3. Life-cycle cost analysis – Perform life-cycle cost (LCC) analysis of all measures – the preferred tool for analysis is the Building Life-Cycle Cost (BLCC) analysis program for this analysis activity www.femp.energy.gov/information/download_blcc.html.
The Life-Cycle Cost analysis (LCC) Water and wastewater costs and other ancillary costs of water-consuming equipment, such as energy, operations and maintenance (O&M), and chemicals 2. Estimated water and wastewater escalation rates 3. Available utility rebates for installed measures, if applicable 4. Prioritization of efficiency opportunities – Rank each measure based on LCC effectiveness and installation cost, addressing both short-term and long-term investment opportunities.
SUMMARY Deliverables and Schedule The contractor shall deliver the following items by noted the due dates: Phase I: Background Development and Preparation • [2/12/2012]: Kick-off meeting summary that documents key items addressed by facility team • [3/05/2013]: List of prioritized buildings for walk-through audits Phase II: Walk-Through Audits • [4/06/2013]: Summary report of walk-through audits that includes major issues or problems encountered during the surveys Phase III: Water Balance Development • [10/07/2013]: Interim water balance shown in graphical form that shows all major water uses by end-use (as defined in Phase II) and comparison to incoming supply and discharged wastewater that reveals estimated losses of the system
Final Report • • [10/08/2013] Executive summary – Provide a concise overview of the major results of the assessment that includes the following: • o Prioritized list of water efficiency opportunities • o Baseline water use and method used to determine this value • o Water and wastewater rates, marginal costs of water and wastewater, and other associated costs, such as energy • o Water distribution curve that provides water use over time showing historic seasonal fluctuations • o Water balance shown in graphical form that shows all major water uses by end use and comparison to incoming supply and discharged wastewater that reveals estimated losses of the system. • Include general methods used to estimate end-use consumption • o Detailed information on efficiency opportunities that include O&M, retrofit, and replacement options for each major water-using piece of equipment, as well as recommendation for sub-metering • o Prioritized list of water efficiency opportunities that provides total water, energy, and cost savings and life-cycle cost effectiveness indicator (such as savings to investment ratio or adjusted internal rate of return) • o Alternate water sources with estimated potential of annual water volume, as well as potential applications where the alternate source could be utilized • o Plan for meeting annual water reduction goals.
PINCH ANALYSIS FOR ENERGY OPTIMIZATION The process data is represented as a set of energy flows, or streams, as a function of heat load (kW) against temperature (deg C). These data are combined for all the streams in the plant to give composite curves, one for all hot streams (releasing heat) and one for all cold streams (requiring heat). The point of closest approach between the hot and cold composite curves is the pinch point (or just pinch) with a hot stream pinch temperature and a cold stream pinch temperature. This is where the design is most constrained. Hence, by finding this point and starting the design there, the energy targets can be achieved using heat exchangers to recover heat between hot and cold streams in two separate systems, one for temperatures above pinch temperatures and one for temperatures below pinch temperatures. In practice, during the pinch analysis of an existing design, often cross-pinch exchanges of heat are found between a hot stream with its temperature above the pinch and a cold stream below the pinch. Removal of those exchangers by alternative matching makes the process reach its energy target.
INDUSTRIAL PROCESS CALCULATIONS Reactor Design calculation Process flow designs, Piping and Instrumentation Drawing (P&ID) Process Control -Feedback Control Systems that minimises waste and enhances process efficiency Automation Systems – linking system and also deals with plant layout Lean Techniques- Calculation of Takt time and value stream mapping
Sample from my MSc Research with Fawley Refinery The amount into the system is 150,000m3 and out of the system is 91,240.46m3, if this information is fed into the material equation; the amount the system accumulated in the cause of processing the crude oil is 58,759.54m3. Thiscannot disappear into the system without been accounted for within an hour. The volume of the Desalter tank was also measured and can take up to 160,000m3 of crude oil.
Sample from my MSc Research with Fawley Refinery Feedback Control System in the Preheated Storage Tank
Make Use of Navier Stoke Equation for Mass, Momentum and Energy Balance The quantity S can be any of the following fundamental quantities • Total mass • Mass of individual component, in the case of distillation column • Total energy • Momentum
Thank You Hope you enjoy the presentation