Download
1 / 46
520 likes | 742 Views
Date: 2009/12/05. Some investigations on modal identification methods of ambient vibration structures. Le Thai Hoa Wind Engineering Research Center Tokyo Polytechnic University. Contents.

E N D
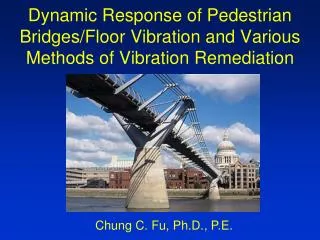
Date: 2009/12/05 Some investigations on modal identification methods of ambient vibration structures Le Thai Hoa Wind Engineering Research Center Tokyo Polytechnic University
Contents 1. Frequency-domain modal identification of ambient vibration structures using combined Frequency Domain Decomposition and Random Decrement Technique 2. Time-domain modal identification of ambient vibration structures using Stochastic Subspace Identification 3. Time-frequency-domain modal identification of ambient vibration structures using Wavelet Transform
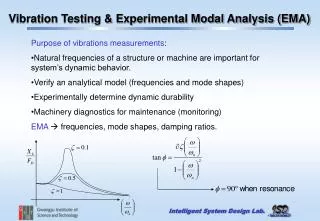
Introduction Modal identification of ambient vibration structures has become a recent issue in structural health monitoring, assessment of engineering structures and structural control Modal parameters identification: natural frequencies, damping and mode shapes Some concepts on modal analysis Experimental/Operational Modal Analysis(EMA/OMA) Input-output/Output-only Modal Identification Deterministic/ Stochastic System Identification Ambient/ Forced/ Base Excitation Tests Time-domain/ Frequency-domain/ Time-scale plane–based modal identification methods Nonparametric/ Parametric identification methods SDOF and MDOF system identifications ….
Vibration tests/modal identification Ambient loads & Micro tremor Indirect & direct identifications Experimental Modal Analysis Output-only Identification Ambient Vibration Tests Operational Modal Analysis Random/Stochastic Shaker (Harmonic) Hummer (Impulse) Sine sweep (Harmonic) Base servo (White noise, Seismic loads) FRF identification Transfer Functions Experimental Modal Analysis Input-output Identification Forced Vibration Tests Operational Modal Analysis Output-only Identification Deterministic/Stochastic Removing harmonic & input effects
Modal identification methods Ambient vibration – Output-only system identification Time domain Frequency domain Time-frequency plane Wavelet Transform (WT) Ibrahim Time Domain (ITD) Frequency Domain Decomposition (FDD) Eigensystem Realization Algorithm (ERA) Hilbert-Huang Transform (HHT) Enhanced Frequency Domain Decomposition (EFDD) Random Decrement Technique (RDT) Stochastic Subspace Identification (SSI) Applicable in conditions and combined [Time-scale Plane] Commercial and industrial uses Academic uses, under development
Commercial Software for OMA ARTeMIS Extractor 2009 Family The State-of-the-Art software for Operational Modal Analysis ODS: Operational Deflection Shapes FDD: Frequency Domain Decomposition EFDD: Enhanced Frequency Domain Decomposition SSI: Stochastic Subspace Identification UPC: Unweighted Principal Component PC: Principal Component CVA: Canonical Variate Algorithm
Uses of FDD, RDT and SSI For MDOF Systems Power Spectral Density Matrix SYY(n) Modal Parameters FDD Response time series Y(t) (POD, SVD…) FDD EFDD (POD, SVD…) ITD RD Functions DYY(t) RDT RDT MRDT CovarianceMatrix RYY(t) Direct method SSI-COV (POD, SVD…) SSI [Time-scale Plane] SSI-DATA Direct method Data Matrix HY(t) (POD, SVD…)
Comparison FDD, RDT and SSI FDD • Advantages: Dealing with cross spectral matrix, good for • natural frequencies and mode shapes estimation • Disadvantage: based on strict assumptions, leakage • due to Fourier transform, damping ratios, effects of inputs • and harmonics; closed frequencies Current trends in modal identification: Combination between identification methods Refined techniques of identification methods Comparisons between identification methods RDT • Advantages: Dealing with data correlation, removing noise • and initial, good for damping estimation, SDOF systems • Disadvantage: MDOF systems, short data record, natural • frequencies and mode shapes combined with other methods SSI • Advantages: Dealing with data directly, no leakage and less • random errors, direct estimation of frequencies, damping • Disadvantage: Stabilization diagram, many parameters
Time Domain Multi-mode RDT Modal Parameters Random Decrement Function RDF RDF-ITD & ERA RDT to refine modal identification RDF-SSI-Covariance RDF-SSI-Data Output Response Time series Y(t) Frequency Domain RDT Power Spectral Matrix RDF-BF RDF-FDD Wavelet Transform (WT) Hilbert-Huang Transform Possibilities of RDT combined with other modal identification methods Time-Frequency Plane Time-frequency Domain
Frequency Domain Decomposition (FDD) Random Decrement Technique (RDT)
Frequency Domain Decomposition • Relation between inputs excitation X(t) and output response • Y(t) can be expressed via the complex FRF function matrix: FDD for output-only identification based on strict points (1) Input uncorrelated white noises Input PSD matrix is diagonal and constant (2) Effective matrix decomposition of output PSD matrix Fast decay after 1st eigenvector or singular vectors for approximation of output PSD matrix (3) Light damping and full-separated frequencies • Also FRF matrix written as normal pole/residue fraction • form, we can obtain the output complex PSD matrix:
Frequency Domain Decomposition • Output spectral matrix estimated from output data Output response PSD matrix • Output spectral matrix is decomposed (SVD, POD…) Frequencies & Damping Ratios Identification Where: Spectral eigenvalues (Singular values) & Spectral eigenvectors (Singular vectors) Mode shapes Identification • ith modal shape identified at selected frequency
Random Decrement Techniques • RDT extracts free decay data from ambient response of structures (as averaging and eliminating initial condition) 0 0 & to Triggering condition Xo Xo RD function (Free decay)
Random Decrement Techniques • RD functions (RD signatures) are formed by averaging • N segments of X(t) with conditional value Xo (Auto-RD signature) Conditional correlation functions (Cross-RD signature) N : Number of averaged time segments X0 : Triggering condition (crossing level) k : Length of segment
Combined FDD-RDT diagram FDD POD, SVD, QR… Natural Frequencies 1st Spectral Eigenvalue Response Data Matrix Y(t) Cross Power Spectral Matrix SYY(n) Free Decay Fun. & Damping Ratios 1st Spectral Eigenvector Mode Shapes FDD-RDT POD, SVD, QR… Natural Frequencies RDT 1st Spectral Eigenvalue RD Fun. DYY(t) Data Matrix Y(t) Cross Power Spectral Matrix SYY(n) Free Decay Fun. & Damping Ratios 1st Spectral Eigenvector Mode Shapes Damping only FDD BPF RDT Natural Frequencies Response Series at Filtered Frequencies Free Decay Fun. & Damping Ratios … at fi
Stochastic Subspace • Identification(SSI) • Covariance-driven SSI • Data-driven SSI
SSI • SSI is parametric modal identification in the time domain. • Some main characteristics are follows: • Dealing directly with raw response time series • Data order and deterministic input signal, noise are • reduced by orthogonal projection and synthesis from • decomposition • SSI has firstly introduced by Van Overschee and • De Moor (1996). Then, developed by several authors • as Hermans and Van de Auweraer(1999); Peeters (2000); • Reynder and Roeck (2008); and other. • SSI has some major benefits as follows: • Unbiased estimation – no leakage • Leakage due to Fourier transform; leakage results • in unpredictable overestimation of damping • No problem with deterministic inputs(harmonics, impulse) • Less random errors: • Noise removing by orthogonal projection
( State-space representation : , • Continuous stochastic state-space model state-space model Second-order equations First order equations A: state matrix; C: output matrix X(t): state vector; Y(t): response vector • Discrete stochastic state-space model wk: process noise (disturbances, modeling, input) vk : sensor noise vk wk wk , vk : zero mean white noises with covariance matrix C yk A Stochastic system
Data reorganizing • Response time series • as discrete data matrix • N: number of samples • M: number of measured points • Reorganizing data matrix either in block Toeplitz matrix • or block Hankel matrix as past (reference) and future blocks Block Hankel matrix shifted t Block Toeplitz matrix past future s: number of block rows N-2s: number of block columns s: number of block rows
SSI-COV and SSI-DATA • Projecting future block Hankel matrix on past one • (as reference): conditional covariance • Data order reduction via decomposing, approximating • projection matrix Ps using first k values & vectors Hankel k: number of singular values k: system order Toeplitz • Observability matrix & system matrices & • Modal parameters estimation Mode shapes: Poles: Frequencies: Damping:
Flow chart of SSI algorithm Data Matrix [Y(t)] SSI-COV Covariance Block Teoplitz Matrix RP [], RF[], Data past/ future Data Rearrangement Parameter s Block Hankel Matrix HP[], HF[] Data Data order reduction Orthogonal Projection Ps SSI-DATA Hankel matrix Parameter k POD Observability Matrix Os System Matrices A, C Toeplitz matrix POD Modal Parameters Stabilization Diagram
Modal identification of ambient vibration structures using combined Frequency Domain Decomposition and Random Decrement Technique Numerical example
Fullscale ambient measurement 5 minutes record Z Floor 5 Floor5 X Y Floor 4 Floor4 Floor 3 Floor3 Floor 2 Floor2 Five-storey steel frame Floor 1 Floor1 Ground Ground (X) Output displacement
Random decrement functions Floor 5 Parameters level crossing: segment: 50s no. of sample: 30000 no. of samples in segment: 5000 Floor 4 Floor 3 Floor 2
Spectral eigenvalues Mode 1 Mode 2 Mode 3 Mode 4 Mode 5 FDD Eigenvalue1: 99.9% Eigenvalue2: 0.07% Eigenvalue3: 0.01% Eigenvalue4: 0% Mode 1 Mode 2 Mode 3 Mode 4 Mode 5 FDD-RDT Eigenvalue1: 100% Eigenvalue2: 0% Eigenvalue3: 0% Eigenvalue4: 0%
Spectral eigenvectors FDD 99.9% 0.01% 0.07% 0%
Spectral eigenvectors FDD-RDT 100% 0% 0% 0%
Mode shapes estimation Mode 1 Mode 2 Mode 3 FDD Mode 4 Mode 5 MAC
Mode shapes comparison Mode 1 Mode 2 Mode 3 Mode 4 Mode 5
Identified auto PSD functions FDD MAC=95% Mode 1 Mode 2 Mode 3 Mode 4 Mode 5 MAC=98%
Identified free decay functions FDD Mode 1 Mode 2 Mode 3 Mode 4 Uncertainty in damping ratios estimation from free decay functions of modes 3 & 4 Mode 5 Unclear with modes 2 & 5
Identified free decay functions FDD Mode 1 Mode 2 Mode 3 Mode 4 Mode 5 Better
FDD - Band-pass filtering Floor 5 X5(t) f1=1.73Hz f2=5.34Hz f3=8.82Hz f4=13.67Hz f5=18.02Hz Response time series at Floor 5 has been filtered on spectral bandwidth around each modal frequency
Damping ratio via FDD-BPF Free decay functions Floor 5 Mode 2 Mode 1 Mode 3 Mode 4 Uncertainty in damping ratios estimated from free decay functions at modes 4 & 5 Mode 5
FDD - Band-pass filtering Floor 1 X1(t) f1=1.73Hz f2=5.34Hz f3=8.82Hz f4=13.67Hz f5=18.02Hz Response time series at Floor 1 has been filtered on spectral bandwidth around each modal frequency
Damping ratio via FDD-BPF Free decay functions Floor 1 Mode 2 Mode 1 Mode 3 Mode 4 Mode 5
Damping ratio via FDD-BPF Selected free decay functions for damping estimation Mode 2 Mode 1 Mode 3 Mode 4 Mode 5
Numerical example Time-domain modal identification of ambient vibration structures using Stochastic Subspace Identification
Parameters formulated Data parameters • Number of measured points: M=6 • Number of data samples: N=30000 • Dimension of data matrix: MxN=6x30000 Hankel matrix parameters • Number of block row: s=20:10:120 (11 cases) • Number of block columns: N-2s • Dimension of Hankel matrix: 2sMx(N-2s) System order parameters • Number of system order: k=5:5:60 (12 cases) • (Number of singular values used)
Projection functions s=50 s=100 s=150 Data after orthogonal projection look like time-shifted sine functions
Effects of s on energy contribution system orders (k) (s) (k) (s) k=10 90-96% Energy k=15 92-97% Energy k=20 93-98% Energy (k) (s)
Frequency diagram 13.67Hz mode 4 mode 5 18.044Hz 1.74Hz 5.34Hz 8.82Hz mode 2 mode 1 mode 3 s=50 k=5:5:60 PSD of response time series
Frequency diagram mode 4 mode 5 mode 2 mode 1 mode 3 s=20:10:120 k=60
Frequency diagram mode 5 mode 4 mode 3 mode 1 mode 2 s=20:10:120 k=60 PSD of response time series
Damping diagram mode 1 0.18% mode 3 mode 2 0.46% 0.22% s=50 k=5:5:60
Damping diagram mode 1 0.18% mode 2 mode 3 0.22% 0.47% s=20:10:120 k=60