Download
1 / 14
140 likes | 258 Views
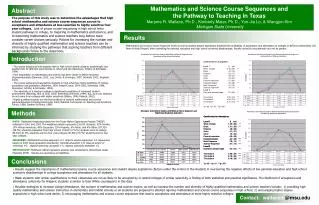
Texas Regional Collaboratives for Excellence in Science and Mathematics Teaching. TRC Professional Development Effectiveness: Impact on Students and Teachers Carol L. Fletcher Assistant Director/R&D Coordinator. TRC Advisory Board March 4, 2008 Austin, Texas. Statewide Impact in 2006-07.

E N D
Texas Regional Collaboratives for Excellence in Science and Mathematics Teaching TRC Professional Development Effectiveness: Impact on Students and Teachers Carol L. Fletcher Assistant Director/R&D Coordinator TRC Advisory Board March 4, 2008 Austin, Texas
Statewide Impact in 2006-07 MATHEMATICS SCIENCE Data compiled from August 1, 2006 - July 31, 2007
Educator Demographics - Science Teachers 2005 - 07 Texas Regional Collaboratives (TRC) professional development priorities as per Texas Education Agency (TEA) guidelines, focused on providing K-8 training on Bridging II TAKS Modules (State endorsed, scientifically researched curriculum), hence increasing the percentage of elementary teachers impacted. Data based on teachers served for funding period August 2006 - July 2007
Mathematics Teachers 2006 - 07 Texas Regional Collaboratives (TRC) professional development priorities as per Texas Education Agency (TEA) guidelines, focused on providing training in a variety of K-12 modules
Economic Status of Participant Schools Data indicates the percentage of students who receive free or reduced lunches on campuses served by the TRC.
Ethnicity of Students Served by Collaborative Teachers 1% 3% 14% 48% 34% Based on actual classroom data reported by TRC science teachers from August 2006 - July 2007.
Program Evaluation – Teacher Knowledge • Science Content • Knowledge
Teacher Content Knowledge Summary of 21 different tests of science content knowledge administered to classroom teachers. Test content covered a range of topics including physics, chemistry, biology, earth science, and science process skills.
Program Evaluation – Student Achievement • Student • Achievement