Download
1 / 36
380 likes | 582 Views
Introduction to probability theory and statistics. HY 335 Presented by: George Fortetsanakis. Roadmap. Elements of probability theory Probability distributions Statistical estimation Reading plots. Terminology. Event: every possible outcome of an experiment.

E N D
Introduction to probability theory and statistics HY 335 Presented by: George Fortetsanakis
Roadmap • Elements of probability theory • Probability distributions • Statistical estimation • Reading plots
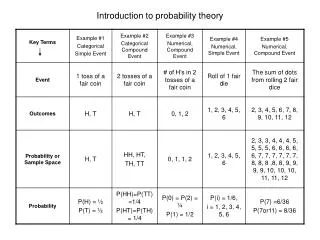
Terminology • Event: every possible outcome of an experiment. • Sample space: The set of all possible outcomes of an experiment Example: Roll a dice • Every possible outcome is an event • Sample space: {1, 2, 3, 4, 5, 6} Example: Toss a coin • Every possible outcome is an event • Sample space: {head, tails}
Probability axioms of Kolmogorov Probability of an event A is a number assigned to this event such that: • : all probabilities lie between 0 and 1 • P(Ø) = 0 : the probability to occur nothing is zero • : The probability of the sample space is 1 A∩B A B
Theorems from the axioms Proof:
Theorems from the axioms Proof: (From axiom 3) (From axiom 4) (From axiom 2)
Independence • A and B are independent if • Outcome A has no effect on outcome B and vice versa. • Example: Probability of tossing heads and then tails is 1/2*1/2 = 1/4
Conditional probabilities Definition of conditional probability: The chain rule: If A, B are independent:
Total probability theorem Assume that B1, B2, …, Bn form a partition of the sampling space: Then: A∩B1 B1 B2 B3 A∩B2 A A∩B3 B5 B4
Roadmap • Elements of probability theory • Probability distributions • Statistical estimation • Reading plots
Probability mass function • Defined for discrete random variable X with domain D. • Maps each element x∈D to a positive number P(x) such that • P(x) is the probability that x will occur. P(x) Probability mass function of fair dice x 1 2 3 4 5 6
Geometric distribution Distribution of number of trials until desired event occurs. • Desired event: d∈D • Probability of desired event: p Number of trials Probability of k-1 failures Probability of success
Continuous Distributions • Continuous random variable X takes values in subset of real numbers D⊆R • X corresponds to measurement of some property, e.g., length, weight • Not possible to talk about the probability of X taking a specific value • Instead talk about probability of X lying in a given interval
Probability density function (pdf) • Continuous function p(x) defined for each x∈D • Probability of X lying in interval I⊆D computed by integral: • Examples: • Important property:
Cumulative distribution function (cdf) • For each x∈D defines the probability Important properties: Complementary cumulative distribution function (ccdf)
Expectations • Mean value • Variance: indicates depression of samples around the mean value • Standard deviation
Gaussian distribution Probability density function • Parameters • mean: μ • standard deviation: σ
Exponential distribution Probability density function Cumulative distribution function Memoryless property:
Poisson process Random process that describes the timestamps of various events • Telephone call arrivals • Packet arrivals on a router Time between two consecutive arrivals follows exponential distribution Time intervals t1, t2, t3, … are drawn from exponential distribution Arrival 1 Arrival 2 Arrival 3 Arrival 4 Arrival 5 Arrival 6 Arrival 7 … t1 t2 t3 t4 t5 t6
Problem definition Dataset D={x1, x2, …, xk} collected by network administrator • Arrivals of users in the network • Arrivals of packets on a wireless router How can we compute the parameter λ of the exponential distribution that better fits the data?
Maximum likelihood estimation Maximize likelihood of obtaining the data with respect toparameter λ Likelihood function Due to independence of samples
Estimate parameter λ • Probability density function • Define the log-likelihood function • Set derivative equal to 0 to find maximum
Roadmap • Elements of probability theory • Probability distributions • Statistical estimation • Reading plots
Basic statistics Suppose a set of measurements x = [x1 x2 … xn] • Estimation of mean value: (matlab m=mean(x);) • Estimation of standard deviation: (matlab s=std(x);)
Estimate pdf • Suppose dataset x = [x1 x2 … xn] • Can we estimate the pdf that values in x follow?
Estimate pdf • Suppose dataset x = [x1 x2 … xn] • Can we estimate the pdf that values in x follow? Produce histogram
Step 1 • Divide sampling space into a number of bins • Measure the number of samples in each bin 4 -4 -2 0 2 3 samples 5 samples 6 samples 2 samples 4 -4 -2 0 2
Step 2 • E = total area under histogram plot = 2*3 + 2*5 + 2*6 +2*2 = 32 • Normalize y axis by dividing by E 6 5 Frequency 3 2 4 -4 -2 0 2 x 6/32 5/32 P(x) 3/32 2/32 4 -4 -2 0 2 x
Matlab code function produce_histogram(x, bins) % input parameters % X =[x1; x2; … xn]: a column vector containing the data x1, x2, …, xn. % bins = [b1; b2; …bk]: A vector that Divides the sampling space in bins % centered around the points b1, b2, …, bk. figure; % Create a new figure [f y] = hist(x, bins); % Assign your data points to the corresponding bins bar(y, f/trapz(y,f), 1); % Plot the histogram xlabel('x'); % Name axis x ylabel('p(x)'); % Name axis y end
Histogram examples Bin spacing 0.1 Bin spacing 0.05 1000 samples 10000 samples
Empirical cdf How can we estimate the cdf that values in x follow? • Use matlab function ecdf(x) Empirical cdf estimated with 300 samples from normal distribution
Percentiles • Values of variable below which a certain percentage of observations fall • 80th percentile is the value, below which 80 % of observations fall. 80th percentile
Estimate percentiles Percentiles in matlab: p = prctile(x, y); • y takes values in interval [0 100] • 80th percentile: p = prctile(x, 80); Median: the 50th percentile • med = prctile(x, 50); or • med = median(x); Why is median different than the mean? • Suppose dataset x = [1 100 100]: mean = 201/3=67, median = 100
Roadmap • Elements of probability theory • Probability distributions • Statistical estimation • Reading plots
Reading empirical cdfs Short tails Long tails