Download
1 / 22
230 likes | 509 Views
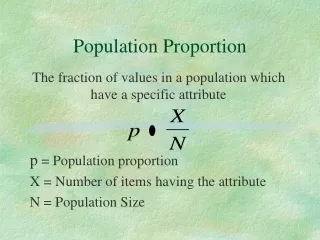
Section 7.2 Estimating a Population Proportion. Objective Find the confidence interval for a population proportion p Determine the sample size needed to estimate a population proportion p. Definitions. The best point estimate for a population proportion p is the sample proportion p

E N D
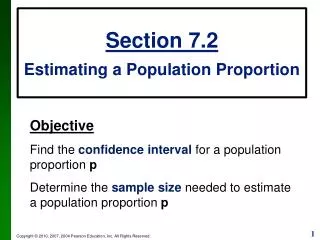
Section 7.2Estimating a Population Proportion Objective Find the confidence intervalfor a population proportion p Determine the sample sizeneeded to estimate a population proportion p
Definitions The best point estimatefor a population proportion p is the sample proportion p Best point estimate :p The margin of error Eis the maximum likely difference between the observed value and true value of the population proportion p (with probability is 1–α)
Margin of Error for Proportions E= margin of error p= sample proportion q= 1 – p n= number sample values 1 – α = Confidence Level
ˆ ˆ ( p – E, p + E ) Confidence Interval for a Population Proportion p where
Finding the Point Estimate and E from a Confidence Interval Point estimate of p: p=(upper confidence limit) + (lower confidence limit) 2 Margin of Error: E = (upper confidence limit) — (lower confidence limit) 2
Round-Off Rule for Confidence Interval Estimates of p • Round the confidence interval limits for p to three significant digits.
Example 1 Find the 95%confidence interval for the population proportion If a sample of size 100 has a proportion 0.67 Direct Computation
Example 1 Find the 95%confidence interval for the population proportion If a sample of size 100 has a proportion 0.67 Using StatCrunch Stat → Proportions → One Sample → with Summary
Example 1 Find the 95%confidence interval for the population proportion If a sample of size 100 has a proportion 0.67 Using StatCrunch Enter Values
Example 1 Find the 95%confidence interval for the population proportion If a sample of size 100 has a proportion 0.67 Using StatCrunch Click ‘Next’
Example 1 Find the 95%confidence interval for the population proportion If a sample of size 100 has a proportion 0.67 Using StatCrunch Select ‘Confidence Interval’
Example 1 Find the 95%confidence interval for the population proportion If a sample of size 100 has a proportion 0.67 Using StatCrunch Enter Confidence Level, then click ‘Calculate’
Example 1 Find the 95%confidence interval for the population proportion If a sample of size 100 has a proportion 0.67 Using StatCrunch Standard Error Lower Limit Upper Limit From the output, we find the Confidence interval is CI = (0.578, 0.762)
Sample Size Suppose we want to collect sample data in order to estimate some population proportion. The question is how manysample items must be obtained?
ˆ ˆ p q z E= a / 2 n (solve for n by algebra) ˆ ˆ Z ()2 a / 2 p q n = E 2 Determining Sample Size
ˆ When an estimate of p is known: ˆ z ˆ ()2 p q a / 2 n = E 2 ˆ When no estimate of p is known: use p = q = 0.5 z ()2 a / 2 0.25 n = E 2 Sample Size for Estimating Proportion p ˆ ˆ
Round-Off Rule for Determining Sample Size If the computed sample size n is not a whole number, round the value of nup to the next larger whole number. Examples: n = 310.67 round up to 311 n = 295.23 round up to 296 n = 113.01 round up to 114
Example 2 A manager for E-Bay wants to determine thecurrent percentage of U.S. adults who now use the Internet. How many adults must be surveyed in order to be 95% confident that the sample percentage is in error by no more than three percentage points when… (a) In 2006, 73% of adults used the Internet. (b) No known possible value of the proportion.
Example 2 (a) Given: Given a sample has proportion of 0.73, To be 95% confident that our sample proportion is within three percentage points of the true proportion, we need at least 842 adults.
Example 2 (b) Given: For any sample, To be 95% confident that our sample proportion is within three percentage points of the true proportion, we need at least 1068 adults.
SummaryConfidence Interval of a Proportion E= margin of error p= sample proportion n= number sample values 1 – α = Confidence Level ( p – E, p + E )
ˆ z ˆ ()2 p q a / 2 n = E 2 When no estimate of p is known (use p = q = 0.5) z ()2 a / 2 0.25 n = E 2 SummarySample Size for Estimating a Proportion When an estimate of p is known: