Download
1 / 29
290 likes | 500 Views
Managing Exports. Chapter 6 Import-Export Sales and Exchange Rates The Market for US Dollars as Foreign Exchange Foreign Exchange Risk Management Determinants of the Long-Run Trends in Exchange Rates Purchasing Power Parity International Trade and Trading Blocs (EU & NAFTA)

E N D
Managing Exports Chapter 6 • Import-Export Sales and Exchange Rates • The Market for US Dollars as Foreign Exchange • Foreign Exchange Risk Management • Determinants of the Long-Run Trends in Exchange Rates • Purchasing Power Parity • International Trade and Trading Blocs (EU & NAFTA) • Comparative Advantage and Trade • Trade Deficits and the Balance of Payments 2005 South-Western Publishing
Import-Export Sales and Exchange Rates • More and more firm are becoming multinational enterprises. • Exports and imports are influenced by changes in international exchange rates. • Differences in long run inflation rates (according to the theory of purchasing power parity), national economic growth rates, and interest rates help explain long-term exchange rate movements.
Competitiveness and Exchange Rates • The international competitiveness of products is affected by exchange rates. • If the US exports a Jeep Grand Cherokee that sells for $30,000, the price of the same car in Europe is vastly different • In 2000, $/€ = $.86/€. If that car costs $30,000, then in Euros that is $30,000 / $.860/€ or €34,884. • When $/€ = $.86/€, then €/$ = 1/ $.86/€ = €1.163/$ • In 2004, $/€ = $1.20/€. If that same car costs $30,000, then in Euros that is $30,000 / $1.20/€ or €25,000. • When $/€ = $1.20/€, then €/$ = 1/ $1.20/€ = €.833/$ • Clearly, more Jeeps are likely to be sold in Europe at the lower than the higher price.
Foreign Exchange Risk Exposure • Translation Risk Exposure – occurs when foreign assets or liabilities are affected by exchange rates. • Disney owns a park near Paris. When the Euro rises against the dollar, the value of the land rises in terms of dollars. This is primarily an accounting adjustment. • Transaction Risk Exposure – occurs when a purchase or sale is made in the future, which involves a foreign currency. • When Cummins Engine sells equipment to Japan in Yen, but they give 60 days before the payment is due, there is a risk that the Yen will fall in value. • Operating Risk Exposure – occurs when cash flows of the firm are impacted by exchange rates. • When Jeep sells more Grand Cherokees when the value of the dollar is low, and less when it is high, this is operating risk exposure. This is the most important risk.
The Market for US Dollars as Foreign Exchange Jeep, BMW, and Cummins Engine are buying and selling foreign exchange in the market. Governments also intervene by buying or selling currencies Spot Pricefor foreign exchange is current price (2 day delivery) can appear in different terms The $/€ is the direct quote in the US, but the indirect quote in Europe The €/$ is the indirect quote in the US, but the direct quote in the Europe Forward Price is the price of a foreign currency for delivery at a future date agreed by contract today
Canadian Dollar Spot and Forward Rates June 21, 2004 from http://www.bmo.com/economic/regular/fxrates.html Country US $ equivalent Per US $ Canada (C$).7331 1.3631 1-month forward .7327 1.3648 2-months forward .7322 1.3657 3-months forward .7320 1.3661 6-months forward .7312 1.3676 12-months forward .7298 1.3702 What does the market think will happen to the C$ based on the forward rates?
Cross Rates(June 22, 2004) Source: http://www.bloomberg.com/markets/currencies/fxc.html USD: U.S. Dollar GBP: British Pound CAD: Canadian Dollar EUR: Euro CHF: Swiss Franc AUD: Australian Dollar HKD: Hong Kong Dollar JPY: Japanese Yen
Supply & Demand Model of Exchange Rates $/SFr • Foreign Exchange is used for trade and investment. Use a supply & demand model to explore FX rates • Demand for Swiss Francs (SFr):Demand is associated with US demand forimportsfrom Switzerland and purchase of Swiss financial securities 1,000 SFr D SFr
Supply of SFr S • Supply of SFr -- Supply is associated with SWISS demand for USexportsand US financial investments. • Market Clears-- no excess demand or excess supply of SF • In Flexible Markets, buying & selling through international banks $/SFr $.7993 D SFr
Suppose that there is a rise in the Inflation Ratein the US S' S • Both Supply & Demand of SFr Shift • SWISS products appear cheaper, so D shifts to D’ • US exports appear more expensive, so S shifts from S to S’ • The SFr appreciates, and the dollar depreciates $2/SFr $1/SFr D' D SFr
Demand for Swiss investments declines, from D to D’ Supply of Swiss francs rises as Swiss seek to invest in the US from S to S’ Swiss francs fall in value and the dollar rises in value What happens when Greenspan CUTS interest rates? Suppose US interest rates rise. S S’ $1/SFr $2/SFr D D'
Governmental Intervention in Foreign Exchange Markets • Governments can and do intervene in markets • Directly by buying and selling foreign currencies • And indirectly by altering interest rates or inflation rates • Sterilized Interventions involve offsetting an indirect move (like an increase in short term interest rates) through direct action in the foreign currency markets • Coordinated Interventions involve several countries all agreeing to intervene to raise or lower the exchange rate of some country.
Foreign Exchange Risk Management • Internal hedges – multinational firms buy and sell within the firm in any currency that they select. • BMW could use sale of its cars in $ payables to buy US car parts • Hedges using forward contracts – firms can offset exposure in foreign currency by buying or selling that amount of currency in a forward contract. • This is a typical way to reduce transaction risk exposure • Hedges using future or options contracts – firm may offset risk with a futures contract in that currency. • Foreign currency futures and options are limited to the major currencies • Hedges using currency swaps – firms may agree to exchange (swap) streams of payments in different currencies, with adjustments at each settlement date.
Determinants of Long-Run Trends in Exchange Rates 1. Countries that have high growth rates in GDP tend to have rising currency values. 2. Countries tend to have a declining value of their currency when they run trade deficits, and tend to have rising currency values if they run trade surpluses. 3.Long-run trends in exchange rates are affected by differences in inflation-adjusted interest rates. High relative interest rates attract investors, tending to raise the value of the currency. 4.Countries with highinflationtend to depreciate; countries with low relative inflation appreciate.
Purchasing Power Parity (PPP) • Purchasing power parity says that the price of traded goods tends to be equal around the world. This is: the law of one price. • if exchange rates are flexible and there are no significant costs or barriers to trade, then: S1 = ( 1 + h ) S0 ( 1 + f ) S1/S0 shows the expected change in the direct quote of a currency. The right side of the equation is the ratio of home and foreign inflation rates. If the foreign inflation rises (f), then the domestic expected future spot rates S1 declines.
PPP Example • Suppose inflation in the US is 3% • Suppose that inflation in Canada is 4% • The currency price of the Canadian dollar is $.74/C$. • What is the expected price of the Canadian dollar in one year? • Answer: S1 = ( 1 + h ) = 1.03 = .9903 =S1 S0 ( 1 + f ) 1.04 .74 • Hence, S1 = .74*.9903 = $.732822 /C$, a slight decline from $.74.
Qualifications of PPP • PPP is sensitive to the starting point, S0. The base time period may not in equilibrium • Differences in the traded goods, or cross-cultural differences, may prevent the law of one price to equilibrate price differences. • The inflation rate used may include some non-traded goods. • PPP tends to work better in the long run than in short run changes in inflationary expectations.
Trade-Weighted Exchange Rate Index • With many countries and many exchange rates, whether a currency rose or fell is complex. We tend to combine the cost of foreign currency into an index based on the amount of trade to each country. • The trade-weighted exchange rate index is a measure of the value of the dollar. • The index, EER, is weighted by the amount of trade with other countries, wit. An index of the change in value of pairs of currencies since a base year, eI$it. • If £.40/$ is the exchange rate in the base year and is now £.60/$, then the index is (£.60/$) /(£.40/$) · 100 = 150. • This means that the dollar is 50% more expensive to the British. The index is:
International Trade and Trading Blocs • With no barriers to trade in a free trade block, such as we have in North America because of NAFTA, trade expands • In 1980, 33% of US trade was in North American. In 1999, that number is 47%. • In 1980, 57% of European trade was in Europe. In 1999, that percentage rose to 61% • In 1980, 13% of trade in South America in the bloc know as MERCOSUR was within that region. In 1999, that percentage rose to 22% • In each case, freer trade within the region led to more intraregional trade. See Table 6.3 on page 263.
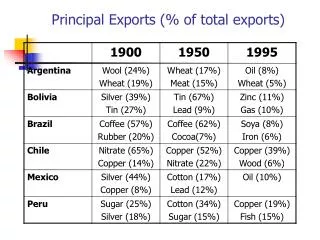
Real Terms of TradeExample: page 265 Table 6.4 Absolute Cost US Absolute Cost Japan Carburetors $120 ¥10,000 Memory Chips $300 ¥ 8,000 The question is: Which country should make carburetors and which should make chips?
Comparative Advantage • Countries or firms should produce more of those goods for which they have lower relative cost. • Relative Cost in US Relative Cost in Japan • Carburetors .4 Chips = $120/$300 1.25 Chips • Computer Chips 2.5 Carb = $300/$120 .8 Carburetors • It costs $120 in the US to make a carburetor and $300 to make chips, the “cost” of a carburetor is the .4 chips foregone (take the ratio $120/$300 to find .4 chips). • The US relative cost of carburetors is much lower than that of the Japanese (1.25 Chips), whereas the Japanese relative cost of chips (.8 Carburetors) is much lower than that of the US. • Japan should make chips and US should make carburetors.
Gains from Comparative Advantage • In this example, suppose that both countries currently make 1 carburetor and 1 chip. • World production is 2 carburetors and 2 memory chips before trade. • Now, let the US make all of the carburetors. Since each chip given up is 2.5 carburetors, the US now makes 3.5 carburetors (the one they were making and the 2.5 extra ones made). • Let also Japan specialize in memory chips. They stop making the carburetor and make instead 1.25 chips. Along with the original chip, they make 2.25 chips. • World production rose to 3.5 carburetors and 2.25 chips through comparative advantage. • Both countries will be richer by this trade.
Tariffs Expands domestic production But raises the price for consumers Import quotas Raises the price for consumers Exchange rate controls Reduces trade Larger free trade regions called trading blocs European Community and the Euro NAFTA Expansion of NAFTA with Latin America and MERCOSUR Attempts toExpand Free Trade Restrictionson Free Trade
Supply and Demand Analysis of Trade • Situation without a tariff • Small Country -- imports oil at Pw DOMESTIC SUPPLY Pw DOMESTIC DEMAND Sd Qd Dd Quantity of Oil Amount of oil imported is Dd - Sd
Impact of Tariffs with S&D Curves DOMESTIC SUPPLY • Situation where PT is the price with a tariff PT Pw DOMESTIC DEMAND Sd S’d D’d Dd Quantity of Oil • Domestic production increases to S’d • Domestic consumption decreases to D’d
Other Protectionist Measures:Quotas & Voluntary Export Restraints } S P • Quotas -- limit number of imports • Voluntary restraints are quotas • Non-tariff regulations are barriers • safety rules, pollution rules • Metric / non-metric standards • ISO 9000, quality rules, and the CE Mark D Q quota added costs P W’ P W Q
Optimal Currency Areas • The Optimal Currency Area involves the question of how many different currencies are best. • If all of Europe has only one currency, trade is quite easy. • But if Italy needs assistance, for example, reducing the value of the Euro for the whole group of countries doesn't target the single ailing region. • Hence, it is an open question as to how many currencies Europe should have. • It is expected that the Euro will help the participating countries, but it makes helping the poorest countries harder.
One Currency for North America? • Should the US, Canada, and Mexico consider having one united currency, the Peso-Dollar? • The US has the same currency in all 50 states, and this has helped the US. All states have open borders, so Ohio workers can move to Missouri if they want to find work. • But one currency makes helping poorer states harder. • If problems arise in Mexico, they would not be able to depreciate the peso to help. • Also, open borders within North America does not exactly exist. $
Trade Deficits and Balance of Payments • The current account reflects goods and service trade flows, receipts and payments US assets abroad and foreign assets in the US, and unilateral governmental and private transfers (such as foreign aid or gifts to foreign family members). • The capital account reflects capital inflows and outflows of foreign assets. The capital account includes transfers in and out of securities, bonds, and financial claims on other assets and liabilities, as well as official reserves, International Monetary Fund balances and gold. • If there is a current account deficit, the needed funds come from borrowing from abroad (a capital account inflow). • The current account (deficit or surplus) comes from a capital account (surplus or deficit) to balance payments. This is the idea behind the accounting identity of the balance of payments.