Download
1 / 15
190 likes | 648 Views
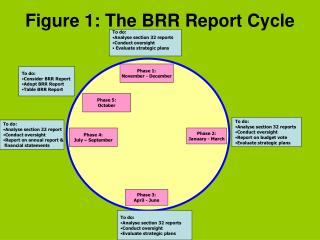
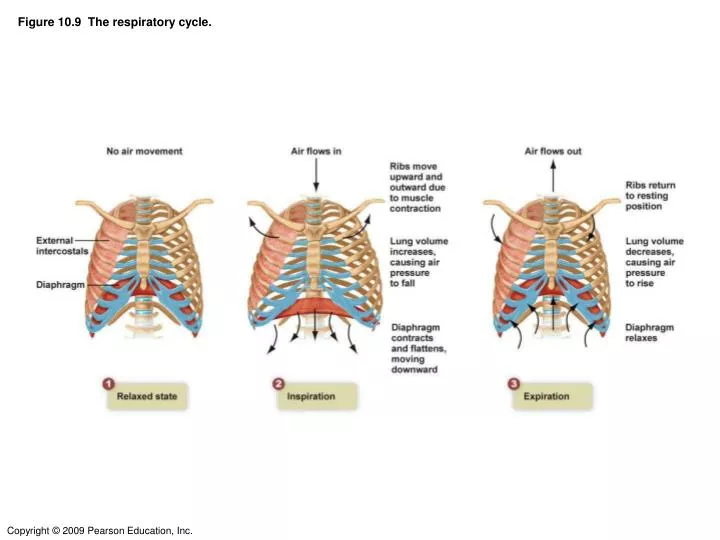
Figure 10.9 The respiratory cycle. Regulation of Breathing. Figure 10.13. Respiratory centers in the pons and medulla oblongata control b oth the rate of respiration and the inspiratory depth. Higher brain centers, in the cerebrum, have conscious control, and can modify breathing.

E N D
Regulation of Breathing Figure 10.13
Respiratory centers in the pons and medulla oblongata control both the rate of respiration and the inspiratory depth. • Higher brain centers, in the cerebrum, have conscious control, and can modify breathing.
Regulation of Breathing • Medulla oblongata: sensitive to hydrogen ions (pH) in cerebrospinal fluid resulting from carbon dioxide in blood • Carotid and aortic bodies: sensitive to oxygen and hydrogen ion (pH) levels
Carbon dioxide & pH • Carbon dioxide is a waste product in exhaled air • Forms an acid in water: CO2 + H2O carbonic acid (H2CO3) H2CO3 bicarbonate (HCO3-) + hydrogen ion (H+) • pH is a measure of the hydrogen ion concentration
The bicarbonate buffer system in blood • The carbonic acid–bicarbonate buffer system (like all buffers) resists pH changes. • If H+ concentrations in blood begin to rise, excess H+ is removed by combining with HCO3– . • If hydrogen ion concentrations begin to drop, H2CO3 dissociates, releasing H+
Respiratory Volumes • Tidal volume (TV) – air that moves into and out of the lungs with each breath (approximately 500 ml) • Inspiratory reserve volume (IRV) – air that can be inspired forcibly beyond the tidal volume (2100–3200ml) • Expiratory reserve volume (ERV) – air that can be evacuated from the lungs after a tidal expiration (1000-1200ml) • Residual volume (RV) – air left in the lungs after strenuous expiration (1200ml)
Respiratory Capacities • Vital capacity (VC) – the total amount of air that can be taken in by the deepest expiration followed by the deepest inspiration = TV + ERV + IRV • Total lung capacity (TLC) – sum of all lung volumes = VC + Residual Volume (approximately 6000 ml in males)
Other Pulmonary Function Tests • Forced vital capacity (FVC) – gas forcibly & rapidly expelled after taking a deep breath • Forced expiratory volume (FEV = peak flow) – the amount of gas expelled during specific time intervals (usually 1 sec)