Download
1 / 29
290 likes | 473 Views
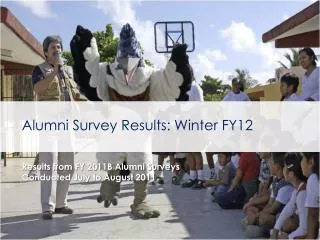
FY 2013 Alumni Survey Results. Agenda . Survey Limitations. Response bias Not a random sample Low sample size Only 70% of all alumni receive the survey Translation and linguistic challenges Large number of survey questions skipped. Survey Response Rates Analysis (FY 2011-2013).

E N D
Survey Limitations • Response bias • Not a random sample • Low sample size • Only 70% of all alumni receive the survey • Translation and linguistic challenges • Large number of survey questions skipped
Survey Response Rates Analysis (FY 2011-2013) (FY 13) (FY 12) (FY 11) Sample Size Needed**: 172 190 198 # of Additional Surveys Needed: 105 135 123 *Note:Based on cohort estimates . Survey sent to roughly 70% of Alumni; not a precise count. Note**: Based on 95% confidence level and 5% confidence interval.
Implications of Low Sample Size • Difficult to assess whether results are representative of larger population • Inconclusive results • Difficult to generalize about trends
Methodology (Cont.) - Sample Size (FY 13) • 75 Total Responses • 65 Alumni CMs • 10 Alumni Supervisors/Directors • Only valid responses are counted. Questions that were skipped do not count as valid responses
Executive Summary – FY13 Pluses • *Strong BSC Scores • 96% involved in conservation • 76% continue to use Pride methodology • *Inspiring Conservation & Pride • 83% influenced others to accomplish something significant in conservation • 65% continued their Pride campaign after formal partnership with Rare ended • *Delivering Conservation Impact • 92% report that their campaign is still leading to the reduction of significant threat • 96% report that Pride process is a useful strategic tool • *Note:These results represent only those alumni who responded. Given the low sample size, it is difficult to draw any conclusions. Please contact CRM to communicate this data externally.
Executive Summary – FY 13 Pluses (Cont.) • *Building Constituency • 97% report that Pride process trains them to mobilize community to reduce threats to biodiversity • 88%report that support for biodiversity efforts in the target area increased among locals • *Developing Capacity • 66% of Alumni Rare Fellows received a promotion or other professional recognition in the last year • 43% of Alumni Rare Fellows articles on conservation published • *Note:These results represent only those alumni who responded. Given the low sample size, it is difficult to draw any conclusions. Please contact CRM to communicate this data externally.
Executive Summary – FY 13 Deltas Decline in the % of alumni who are very (or completely) likely to recommend Pride, from 92% in 2011 to 84% in 2012 to 76% in 2013. *Note:These results represent only those alumni who responded. Given the low sample size, it is difficult to draw any conclusions. Please contact CRM to communicate this data externally.
Executive Summary – FY 13 Deltas (Cont.) Similarly, the average recommendation score fell from to 4.5 in 2011 to 4.2 in 2012 to 4.0 in 2013 (on a 1-5 Scale) *Note:These results represent only those alumni who responded. Given the low sample size, it is difficult to draw any conclusions. Please contact CRM to communicate this data externally.
Executive Summary – FY 13 Deltas (Cont.) For Alumni who completed the survey more than once between FY11-13: *Note:These results represent only those alumni who responded. Given the low sample size, it is difficult to draw any conclusions. Please contact CRM to communicate this data externally.
FY 2011-2013 Summary Results *Note:These results represent only those alumni who responded. Given the low sample size, it is difficult to draw any conclusions. Please contact CRM to communicate this data externally.
Key Takeaways • Overall, positive results for FY 13 across nearly all metrics • Strong network effects suggest that Alumni are actively engaged and find Pride training valuable • One key to area to explore is why the % of Alumni likely to recommend Pride to other organizations has declined in FY 12 and FY 13 • Inconclusive results due to low survey sample size
Proposed Recommendations • Update Alumni Survey by making it more concise and clear, ensuring it captures only critical information needed for decision-making • Improve our Alumni Contact List for each region to ensure our sample size is adequate to ensure the results are representative • Create a LinkedIn Alumni Group! • Brainstorm ideas to incentivize survey completion • Engage Alumni Managers in the regions on possible reasons as well as solutions to address the declining % of Alumni who recommend Pride
Proposed Next Steps • Engage stakeholders on improving the survey (Eddie & Liz will facilitate) • Update Alumni contact database (Alumni Managers & Teams) • Identify a leader to initiate Alumni LinkedIn Group • Add two agenda items to upcoming Alumni Management Team calls: • Incentive ideas for completing surveys • Alumni likely to recommend Pride
Survey Methodology • Integration: 5 point scale to integrate into the Pride Scorecard and Rare's Balanced Scorecard (BSC). Scales designed by Vovici Market Research. • Multi-perspective: Similar questions across the audience to provide comparability across audiences and if possible across regions. • Longitudinal: Similar questions across time to assess progress or change in perceptions. • Net Promoter:used as the “Ultimate Question” of customer satisfaction-- “How likely are you to recommend a Pride campaign to colleagues or other organizations?” Method designed by Bain & Company Consulting.
Analysis of Results 1. Inspiring Conservation & Pride “I recommend Pride because it is the key to empowering local actors.“ Elizabeth Cabrera, Guad Alumni Fellow
Analysis of Results 2. Delivering Conservation Impact • “I recommend Pride because it proved to deliver conservation impact at my site. This approach is effective and powerful enough to replicate at other sites.” • Yusuf Syaifudin, Bogor Alumni Fellow
Analysis of Results 3. Building Constituency “I recommend Pride because with Pride it is possible to motivate people to change their behavior and to support the conservation work of the local organizations.” Maritza Tovar, GuadAlumniFellow
Analysis of Results 4. Developing Capacity • ““I recommend Pride because it helps to make the organization stronger and more effective in conservation.” • Virgilio Da Silva Guterres, Bogor Alumni Rare Fellow