Download
1 / 92
930 likes | 1.38k Views
PSYC 6130. Multiple Comparisons. Lecture 17 Summary. Why do multiple comparisons The problem with multiple comparisons Familywise and per-comparison alpha Exploratory data analysis Fisher’s protected t tests Tukey’s HSD test Dunnett’s Test REGWQ Test Games-Howell Test

E N D
PSYC 6130 Multiple Comparisons
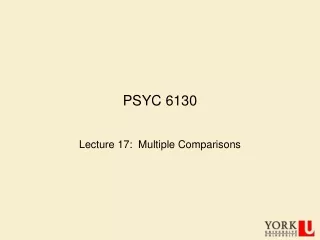
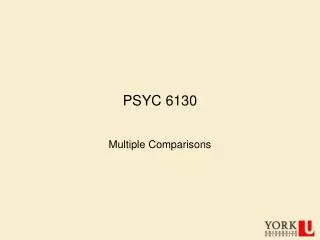
Lecture 17 Summary • Why do multiple comparisons • The problem with multiple comparisons • Familywise and per-comparison alpha • Exploratory data analysis • Fisher’s protected t tests • Tukey’s HSD test • Dunnett’s Test • REGWQ Test • Games-Howell Test • Planned Comparisons • Bonferroni t or Dunn’s Test • Complex Comparisons (Linear Contrasts) • Scheffé’s Test (an exploratory analysis technique that works for complex comparisons). • Recommendations PSYC 6130, PROF. J. ELDER
Why do multiple comparisons? H0 H1 PSYC 6130, PROF. J. ELDER
Number of Comparisons PSYC 6130, PROF. J. ELDER
Number of Comparisons PSYC 6130, PROF. J. ELDER
Number of Comparisons PSYC 6130, PROF. J. ELDER
Number of Possible Comparisons • In general, for an independent variable with k groups the number of possible comparisons is given by: • In our example, k=3, so the number of possible comparisons is: PSYC 6130, PROF. J. ELDER
The Problem with Multiple Comparisons • Each pairwise comparison we do has a 5% chance of resulting in a type I error (assuming ) . PSYC 6130, PROF. J. ELDER
P(Accept,Accept) = 0.95*0.95 =0.9025 P=0.95 Accept H0 Accept H0 Accept H0 P=0.05 P(Accept,Reject) = 0.95*0.05 =0.0475 Comparison 2 P(Reject,Accept) = 0.05*0.95 =0.0475 P=0.95 Reject H0 Reject H0 Reject H0 P(Reject,Reject) = .05*0.05 =0.0025 P=0.05 The Problem with Multiple Comparisons P=0.95 Comparison 1 P=0.05 PSYC 6130, PROF. J. ELDER
The Problem with Multiple Comparisons • If we do 20 comparisons where all of the null hypotheses are actually true, we have a chance of correctly accepting all true null hypotheses and a 1-0.3585 = 0.6415 chance of making at least one Type I error. • In general, the probability of making at least one Type I error in j comparisons is: • This is called the Experimentwise, or Familywise type I error rate. PSYC 6130, PROF. J. ELDER
Example Suppose we wish to make three comparisons at The probability of making at least one type I error is: . PSYC 6130, PROF. J. ELDER
How to Fix the Problem • One way to fix this problem is to reduce the per comparison alpha rate. • This is the main idea behind the approaches we will discuss. PSYC 6130, PROF. J. ELDER
0.45 0.4 0.35 0.3 0.25 0.2 0.15 0.1 0.05 0 -4 -2 0 2 4 6 8 Reality The Trade-Off Your guess H0 H1 tcrit PSYC 6130, PROF. J. ELDER
0.45 0.4 0.35 0.3 0.25 0.2 =Type I error rate 0.15 0.1 0.05 0 -4 -2 0 2 4 6 8 The Trade-Off PSYC 6130, PROF. J. ELDER
The Trade-Off 0.45 0.4 0.35 0.3 0.25 0.2 =Type II error rate 0.15 0.1 0.05 0 -4 -2 0 2 4 6 8 PSYC 6130, PROF. J. ELDER
0.45 0.4 0.35 0.3 =Power 0.25 0.2 0.15 0.1 0.05 0 -4 -2 0 2 4 6 8 The Trade-Off PSYC 6130, PROF. J. ELDER
0.45 0.4 0.35 0.3 0.25 0.2 0.15 0.1 0.05 0 -4 -2 0 2 4 6 8 The Trade-Off =Type I error rate PSYC 6130, PROF. J. ELDER
0.45 0.4 0.35 0.3 =Power 0.25 0.2 0.15 0.1 0.05 0 -4 -2 0 2 4 6 8 The Trade-Off PSYC 6130, PROF. J. ELDER
Exploratory Data Analysis • Analyzing data for possible effects without any prior expectations about what effects might be found is called exploratory data analysis. • In this case we want to detect effects when present, but we want to limit our familywise Type I error rate so that it never exceeds a strict threshold (e.g., 0.05). • Such after-the-fact t-tests are called post-hoc comparisons. PSYC 6130, PROF. J. ELDER
Fisher’s Protected t Tests • Idea: only perform t-tests if an ANOVA analysis indicates a significant effect. • If there is absolutely no effect of the independent variable, this will weed out 95% of the possible Type I errors, thus ensuring the Type I error rate for any subsequent post-hoc t-tests will be less than .05. PSYC 6130, PROF. J. ELDER
Fisher’s Protected t Tests • Used when performing exploratory data analysis at a fixed Type I error rate. • Assumptions: • All your data are independent and normally distributed. • Equal variances in each treatment group (homogeneity of variance). • You have performed an ANOVA on your data and found a significant F-ratio at your preferred type I error rate (e.g. at _______). PSYC 6130, PROF. J. ELDER
Fisher’s protected t tests The formula for a standard (pooled variances) t test is: For Fisher’s protected t tests, we replace the term with the MSw term. PSYC 6130, PROF. J. ELDER
Fisher’s Protected t Tests • Conditions of protection: The null hypothesis is completely true (i.e. ) or only one null hypothesis is true (e.g. ). • Conditions of no protection: The null hypothesis is partially true. e.g., • In this case, if you are testing more than one true null hypothesis then your experimentwise type I error rate accumulates as before. PSYC 6130, PROF. J. ELDER
1. Fisher’s LSD: Degrees of Freedom • Since the estimate of variance is based on all groups in the experiment, the error (denominator) degrees of freedom is: PSYC 6130, PROF. J. ELDER
1. Fisher’s Least Significant Difference (LSD) 2.1>2.03, therefore, reject H0 and conclude that the mean for group A is significantly different from the mean for group B. PSYC 6130, PROF. J. ELDER
Advantages Very powerful Controls familywise Type I error rate when comparing only three treatment means. Controls familywise Type I error rate when at most one null hypothesis is true. Controls familywise Type I error rate when the complete null hypothesis is true. Available in SPSS Disadvantages Very poor Type I error rate in general. 1. Fisher’s LSD PSYC 6130, PROF. J. ELDER
1. Fisher’s LSD • Why is it called “Least Significant Difference”? • Suppose sample sizes are equal. PSYC 6130, PROF. J. ELDER
End of Lecture March 18, 2009
2. Tukey’s Honestly Significant Difference • Fisher’s LSD breaks down for > 3 groups. • Tukey’s HSD works for any number of groups • Key Idea: • Given k groups, consider the smallest and largest means. • Ensure protection against Type I error when comparing these two means. • This is guaranteed to protect against Type I error for the next comparison. PSYC 6130, PROF. J. ELDER
2. Tukey’s HSD • Tukey’s HSD makes use of the studentized range distribution q, which describes the expected, normalized difference between the max and min observed means amongst k treatments, under the null hypothesis: PSYC 6130, PROF. J. ELDER
2. Tukey’s HSD • As for Fisher’s LSD, this formula can be reversed to efficiently determine which means are significantly different: PSYC 6130, PROF. J. ELDER
2. Tukey’s HSD • In Tukey’s HSD, every pairwise difference is compared against this HSD. • Any difference that exceeds the HSD is considered statistically significant. • This guarantee derives from a telescoping form of protection. PSYC 6130, PROF. J. ELDER
2. Tukey’s HSD • Suppose that you order the k means in ascending order: PSYC 6130, PROF. J. ELDER
Accept H0 Accept H0 Stop! Comparison 2 P(Reject,Accept) = 0.05*0.95 =0.0475 P=0.95 Reject H0 Reject H0 P(Reject,Reject) = 0.05*0.05 =0.0025 P=0.05 Intuition behind Tukey’s HSD P=0.95 Comparison 1 P=0.05 “Telescoping protection” PSYC 6130, PROF. J. ELDER
2. Tukey’s HSD Test • Maintains at the chosen value regardless of the number of groups or whether the null hypothesis is completely or partially true. • Assumptions • Normality • Homogeneity of variance • Independent, random samples • Roughly equal sample sizes • Most appropriate when tests are post-hoc and/or all possible pairwise comparisons are being performed. PSYC 6130, PROF. J. ELDER
2. Tukey’s HSD • If the sample sizes are slightly different you can replace n with the harmonic mean of the sample sizes. • k = The number of treatment groups. • ni= The number of elements in treatment group i. PSYC 6130, PROF. J. ELDER
2. Tukey’s HSD PSYC 6130, PROF. J. ELDER
2. Tukey’s HSD From Studentized Range Statistic Table: PSYC 6130, PROF. J. ELDER
2. Tukey’s HSD PSYC 6130, PROF. J. ELDER
2. Tukey’s HSD 55 54 53 52 51 Mean 50 49 48 47 46 45 A B C D Treatment Group PSYC 6130, PROF. J. ELDER
Advantages Type I error is properly controlled for arbitrary number of groups. Does not require an ANOVA. Available in SPSS Disadvantages Overly conservative (low power) for k=3: better to use Fisher’s LSD. Not appropriate if sample sizes or variances are very different. 2. Tukey’s HSD PSYC 6130, PROF. J. ELDER
3. Dunnett’s Test • Dunnett’s test was devised for the situation when: • one condition (e.g., the control condition) is to be compared against all other conditions (e.g., the treatment conditions), and • no other pairwise comparisons are required. • Under these conditions, Dunnett’s test is the most powerful test that accurately prevents inflation of Type I error. • Dunnett’s test is available in SPSS PSYC 6130, PROF. J. ELDER
Advantages Useful for comparing each treatment group mean with a control group mean. In this situation, it’s the most powerful test available that does not allow to rise above its preset value. Disadvantage Limited applicability. Requires homogeneity of variance. 3. Dunnett’s Test PSYC 6130, PROF. J. ELDER
4. REGWQ Test • REGW = Ryan, Einot, Gabriel and Welsh. Q = the studentized range statistic. • More powerful than Tukey’s HSD, but still maintains at the preset value. • Adjusts the critical value separately for each pair of means, depending on how many steps separate each pair when the means are put in order. • Available in SPSS • The test of choice when • k>3 • Dunnett’s test does not apply • Homogeneity of variance applies PSYC 6130, PROF. J. ELDER
Accept H0 Accept H0 Stop! Comparison 2 P(Reject,Accept) = 0.05*0.95 =0.0475 P=0.95 Reject H0 Reject H0 P(Reject,Reject) = 0.05*0.05 =0.0025 P=0.05 Recall Tukey’s HSD This turns out to be stricter than necessary. P=0.95 Comparison 1 P=0.05 “Telescoping protection” PSYC 6130, PROF. J. ELDER
REGWQ • The k means are sorted in ascending order: • Now when we do pairwise comparisons, Instead of basing the critical q value on k, we base it on the number of steps between the two means being compared: PSYC 6130, PROF. J. ELDER
REGWQ PSYC 6130, PROF. J. ELDER
Hours spent sleeping each night Ryan-Einot-Gabriel-Welsch Range Subset Would you describe your life as... N 1 2 VERY STRESSFUL 591 6.89 SOMEWHAT STRESSFUL 590 7.07 NOT AT ALL STRESSFUL 593 7.26 NOT VERY STRESSFUL 597 7.29 Sig. .056 .922 Means for groups in homogeneous subsets are displayed. Alpha = .05. 4. REGWQ Test: Example 1 PSYC 6130, PROF. J. ELDER
MEASURE_1 Ryan-Einot-Gabriel-Welsch Range Subset Category N 1 2 3 Men 30 - 152 1:55:44.16 Men 40 - 219 1:56:21.63 Men 24 & 45 1:57:03.26 1:57:03.26 Men 45 - 177 1:57:12.99 1:57:12.99 Men 25 - 89 1:57:27.04 1:57:27.04 1:57:27.04 Men 35 - 172 1:58:53.89 1:58:53.89 1:58:53.89 Men 50 - 97 2:04:21.63 2:04:21.63 Men 60 - 14 2:06:32.61 2:06:32.61 Men 55 - 50 2:07:30.10 Men 65 - 6 2:23:39.50 Sig. .763 .064 .059 Means for groups in homogeneous subsets are displayed. Alpha = .05. 4. REGWQ Test: Example 2 • Marathon Split Times • Note: due to very different sample sizes, we normally would not choose REGWQ for this dataset. PSYC 6130, PROF. J. ELDER