Download
1 / 33
340 likes | 357 Views
Population Biology. Population Growth. Population = all members of same species (interbreeding organisms) within an ecosystem. Important terms. Population: a group of individuals of the same species that live in the same geographical area

E N D
Population Growth Population = all members of same species (interbreeding organisms) within an ecosystem.
Important terms • Population: a group of individuals of the same species that live in the same geographical area • Population growth; is the change in the size of a population with time • Population size: is the number of individuals in a population • Population density; the number of individual per unit of volume or area
Population Growth • The size of a population changes due to Births and immigration (the movement of individuals into a population) and death and emigration ( the movement of individuals out of a population). • For example • Birth rate is the rate at which reproduction adds new individuals(eg. 300 births into population of 10000 • Birth rate= 300/1000 x100% or 3%immigration is the movement of organism into a new area • Death rate is the rate at which organisms die • Emigration is the m movement of organisms out of an area
Conditions that affect population size! Population growth is limited by "environmental resistance” Density - Dependent Factors(tend to be biotic and involve living things) • Limited resources (food, space, light for photo synthesizers) • Competition interspecific (different species and Intraspecific (same species) • Predation - increased prey means increased predation • Parasitism - spread more easily in high density pops • Disease- close contact at high density, can spread by physical contact • Environmental quality- the conditions affecting the habitat of organisms
Density- Independent Factors (tend to be abiotic) Factors that affect populations regardless of their of their density • Weather (e.g. plants, insects sensitive to extreme hot, cold) • Natural disasters - fire, hurricanes, earthquake, volcanos
BioticPotential • Maximum rate at which a population can increase in ideal conditions. • Ex. A house flies lays 100 eggs in which ½ of the flies are female that can reproduce after 1 month and then die. After 7 generations there will be over 15 billion flies produced. But organisms reach their biotic potential because of such limiting factors as availability of food and space Biotic Potential is affected by the organism’s • Lifespan • Age at first reproduction • Frequency of reproduction • Clutch size (how many offspring produced) • Length of reproductive capability
Populations can grow exponentially... ...If each organism has multiple offspring. For Example • 1 fly lays about 120 eggs • In one year, that one fly has about 5 x 10¹² great, great, great, great grandchildren. • This fly population is meeting its Biotic Potential because it is increasing at the maximum rate possible.
Environmental resistance • The sum of all the limiting factors to prevent a population from reaching its biotic potential is environmental resistance.
Exponential growth of 2 organisms with different biotic potentials • Bacteria divide every 20 minutes; it takes 220 minutes to reach a population of about 2000. • Eagles reproduce once a year starting at age 4 (red) or age 6 (green). It takes about 23 years (red) or 32 years (green) to reach 2000 individuals.
Some populations expand until they reach equilibrium at their limit • Exponential growth under favorable conditions: food, space available, little to no predation, parasitism or competition. • Once the population size matches the carrying capacity of the ecosystem, its growth slows and reaches equilibrium.
Carrying Capacity • Is the maximum population size that can be supported by an • ecosystem over the long term • Is typically limited by the resources available in that ecosystem
Population growth rate curves • These are graphs of the rate of increase in size of a population with time • Examples of population growth curves • Exponential • Logistic or s shaped • Predator prey
Exponential growth or j shaped curve • A graph or population size vs time that can be used to show population growth in an unlimited or ideal environment. A population if left unchecked would grow to an infinitely high number. The curve rises slowly at first (ie. Slow growth or lag phase) and then shoots up rapidly and keeps on going indefinitely(rapid growth or exponential growth)
What happens if a population exceeds carrying capacity? (J-Shaped Curve – Exponential Growth) • Some populations grow too fast… • Population overshoots resources… • Population crashes • E.g. Gypsy Moth caterpillars can defoliate the trees they live on so quickly thattheir larvae have nothing to feed on!
Sometimes they overshoot but are able to stabilize (S-Shaped (Logistical) Curve)
Phases of Population Growth • Lag – Initial Phase of Population Growth. Initially slow due to limited starting point • Exponential Growth – Period of Rapid Expansion. Population is growing rapidly due to a lack of competition and limits. • Equilibrium – Population growth slows dramatically as the carrying capacity is approached. Populations do not fluctuate as rate of increase approximates the rate of decrease.
Logistic growth or shaped • A graph of population size vs time that can show population change that occur in limited environments. • A population increases slowly at first(slow growth or lag phase) rate of change increases quickly(rapid growth or exponential growth) and eventually the population becomes so large that it stops growing altogether(no growth or equilibrium phase-the birth rate and death rate are equal). • The population is near carrying capacity
Predator - Prey relationships can cause cyclical population curves • When prey populations increase, more predation occurs because- (1) predators encounter prey more often and (2) more prey support a bigger predator population. • When predators get too numerous, they reduce the prey population, thus depleting their food supply. • A change in the prey population illicits change in the predator population and vice versa.
Predator-Prey population trends Hare and Lynx Weavil and Wasp
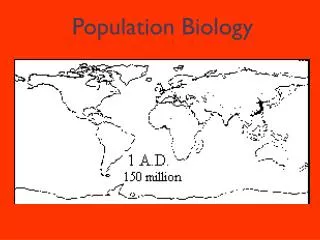
Human Population Growth:When will we hit carrying capacity? Advances have increased the earth’s carrying capacity and pop size
Human population growth • It should be noted that real populations grow exponentially for a short period of time until environmental resistance sets growth limits. For human populations it is presently growing at a very rapid rate
Disease War Famine Space Food Poverty Etc…. Factors that limit Human Population Growth
For our planet there is an upper limit for population size that the earth can support. More industrialized nations have used technology to raise the carrying capacity of their environments • Less industrialized nations have reached or exceeded their carrying capacity for their environments. An increase in population growth puts stress on environmental life support systems. We must curb or control, expanding global human populations • More industrialized have increased carrying capacity but there is still a limit • Less industrialized nations have reached their carrying capacity due to depletion of water, soil resources
Demographic Transition • The demographic transition model seeks to explain the transformation of countries from having high birth and death rates to low birth and death rates. In developed countries this transition began in the eighteenth century and continues today. Less developed countries began the transition later and are still in the midst of earlier stages of the model.
The model is based on the change in crude birth rate (CBR) and crude death rate (CDR) over time. Each is expressed per thousand population. The CBR is determined by taking the number of births in one year in a country, dividing it by the country's population, and multiplying the number by 1000. In 1998, the CBR in Canada is 14 per 1000 (14 births per 1000 people) while in Kenya it is 32 per 1000. The crude death rate is similarly determined. The number of deaths in one year are divided by the population and that figure is multiplied by 1000. This yields a CDR of 9 in the U.S. and 14 in Kenya.
Stage 1 • Prior to the Industrial Revolution, countries in Western Europe had a high BR and DR. Births were high because more children meant more workers on the farm and with the high death rate, families needed more children to ensure survival of the family. Death rates were high due to disease and a lack of hygiene. The high BR and DR were somewhat stable and meant slow growth of a population. Occasional epidemics would dramatically increase the DR for a few years (represented by the "waves" in Stage I of the model.
Stage 2 • In the mid-18th century, the death rate in Western European countries dropped due to improvement in sanitation and medicine. Out of tradition and practice, the birth rate remained high. This dropping death rate but stable birth rate in the beginning of Stage II contributed to skyrocketing population growth rates. Over time, children became an added expense and were less able to contribute to the wealth of a family. For this reason, along with advances in birth control, the BR was reduced through the 20th century in developed countries. BR> DR Populations still grew rapidly but this growth began to slow down. • Many less developed countries are currently in Stage II of the model. For example, Kenya's high BR of 32 per 1000 but low DR of 14 per 1000 contribute to a high rate of growth (as in mid-Stage II).
Stage 3 • In the late 20th century, the BR and DR in developed countries both leveled off at a low rate. In some cases the BR is slightly higher than the DR (as in the U.S. 14 versus 9) while in other countries the BR is less than the DR (as in Germany, 9 versus 11). BR=DR leads to stable population. This is known as zero population growth • Immigration from less developed countries now accounts for much of the population growth in developed countries that are in Stage III of the transition. Countries like China, South Korea, Singapore, and Cuba are rapidly approaching Stage III
Model - Summarised • As with all models, the demographic transition model has its problems. The model does not provide "guidelines" as to how long it takes a country to get from Stage I to III. Western European countries took centuries through some rapidly developing countries like the Economic Tigers are transforming in mere decades. The model also does not predict that all countries will reach Stage III and have stable low birth and death rates. There are factors such as religion that keep some countries' birth rate from dropping.
Model - Summarised • Though this version of the demographic transition is composed of three stages, you'll find similar models in texts as well as ones that include four or even five stages. The shape of the graph is consistent but the divisions in time are the only modification.
Model - Summarised • An understanding of this model, in any of its forms, will help you to better understand population policies and changes in developed and less developed countries around the world. • More industrialized nations-transition to the third stage-our society • Less industrialized-in second stage- a demographic trap