Download
1 / 24
240 likes | 344 Views
Calibration of the C-Mod MSE Diagnostic. Howard Y. Yuh, MIT Steve D. Scott, PPPL R. Granetz, E.S.Marmar, S.M.Wolfe, D.Beals,MIT W.Rowan, R.Bravenec, M.Sampsell, U.Texas Austin. Motional Stark Effect Brief Intro.

E N D
Calibration of the C-Mod MSE Diagnostic Howard Y. Yuh, MIT Steve D. Scott, PPPL R. Granetz, E.S.Marmar, S.M.Wolfe, D.Beals,MIT W.Rowan, R.Bravenec, M.Sampsell, U.Texas Austin
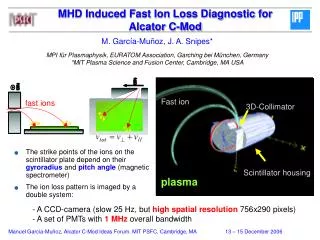
Motional Stark Effect Brief Intro • TheMotional Stark Effect diagnostic measures local magnetic field angle by looking at line radiation (typ. Ha) from high energy neutrals crossing magnetic fields. • Line radiation is polarized relative to the local magnetic field. • By measuring the polarization angle, one can make a local measurement of magnetic pitch angle. • Pitch angle is the atan(Bz / Bt). • Toroidal field measured by magnetics • Knowledge of internal Bz allows for proper solutions of q, j(r). • q = Bfr / BqR
Abstract The C-Mod MSE is operational and data indicate that invessel optics problems have been solved. Beam into gas calibrations showed significant disagreement with EFIT reconstructions, especially near the plasma edge. Detailed modeling of the diagnostic revealed a parasitic dependence on unpolarized and circularly polarized light. The contaminating light must not be present in the same quantity between gas calibration and plasma, and also must be created by the neutral beam directly. Spectrometer data suggests the additional light ischarge exchangefrom C and F impurities present during plasmas, with beam neutrals. Using the unpolarized and circular terms in a regression analysis has greatly reduced the MSE error compared to EFIT. The data shows how the C-Mod MSE must measure the entire Stokes vector on each shot to yield accurate results, and why static angle calibrations, even using plasma jogs/compressions are insufficient. A three part plan to absolutely calibrate MSE is in progress.
Motional Stark Effect • Stark Effect is the influence of external electric field on atomic spectra. • Motional refers to the induced electric field experienced by neutral atoms travelling across a magnetic field. EMS=VbeamB • Induced E in neutral’s rest frame causes a wavelength shift and polarization of emitted radiation. • Dopplar shift combined with Stark splitting allows spectral measurements away from unshifted Ha
C-Mod MSE Progress • Data indicates that new MSE invessel optics have survived undamaged through the Summer 2003 C-Mod campaign (to be verified during manned entry Dec ‘03) • Useful plasma and beam into gas data obtained through the run campaign • Post campaign manned access calibration data necessary to produce accurate measurements
C-Mod MSE Calibration Status Current Calibration Procedure: • The primary calibration is done using beam into gas with known fields • The method of sweeping the plasma edge through each MSE sightline is not currently used due to the short duration of the DNB pulse (50ms) • The results of a plasma sweeping exercise can be observed on the edge channel Results from current calibration: • Using beam into gas calibrations for plasma shots results in large discrepencies at the edge • Edge MSE measurements differ for plasmas with equal Ip • Why?
Müller Calculus Modeling of MSE • Input light is represented using a Stokes vector, S : where I represents intensities of : unpolarized, p-linear in the p direction, s-linear in the s direction, and circular. The pitch angle of the linear polarization is given using an absolute (tokamak) coordinate system as g. gpand gs are orthogonal in tokamak coordinates but not once projected into the MSE view
é ù 1 0 0 0 ê ú ê ú c c ê ú 0 cos ( 2 ) sin ( 2 ) 0 ê ú ê ú - c c ê 0 sin ( 2 ) cos ( 2 ) 0 ú ê ú ê ú ë û 0 0 0 1 é ù 1 0 0 0 ê ú ê ú é c - c ù ê ú 0 cos ( 2 rm ) sin 1 ( 2 rm ) 1 0 ê ú ê ú + - 0 0 ê ú ê ú 2 2 2 2 c c ê ú ê 0 sin ( 2 ) cos ( 2 ) 0 ú ê ú ê ú ê ú ê ú rm 1 rm 1 ë û 0 0 ê 0 1 ú - + 0 0 ê ú ê 2 2 2 2 ú ê ú ê ú ê d d ú 0 0 rm cos ( ) rm sin ( ) ê ú ê ú ê ú ë - d d û 0 0 rm sin ( ) rm cos ( ) Müller Calculus – MSE optical components • C-Mod MSE can be modeled using the the optical train: [linear polarizer] . [PEM2] . [PEM1] . [Reflection Rot.] . [Mirror] . S • Mirror - Modeled as: [rotation] . [partial polarizer] . [unknown retardation waveplate] • Where rm is the S/P reflectivity ratio, and d is the mirror retardation • PEM #1 – Modeled as a time variable waveplate • PEM #2 – Modeled as a rotated time variable waveplate
Müller Calculus – MSE optical components • PEMs: • Where A, B are the time varying retardation of each PEM: cos(A)=cos(A0cos(w1t)) ; cos(B)=cos(B0cos(w2t)) • PEM 2 is at -45° relative to PEM 1 • Linear Polarizer at angle b relative to PEM 1 (ideally 22.5 °):
Intensity Results • Assemble terms in the of light propagation. The total intensity term in the resultant Stoke vector is measured. The result can be represented as: cos(A)=G1Itot +G2(Ipcos(2gp)+Iscos(2gs)) + G3(Ipsin(2gp)+Issin(2gs)) + G4Ic cos(B)=G5Itot + G6(Ipcos(2gp)+Iscos(2gs)) + G7(Ipsin(2gp)+Issin(2gs)) + G8Ic sin(A)= G9(Ipcos(2gp)+Iscos(2gs)) + G10(Ipsin(2gp)+Issin(2gs)) +G11Ic Itot = (Iunpolarized + Ip + Is + Icircular) gp and gp are coupled geometrically G quantities are static coefficients determined by geometry of optical components I quantities are intensities various components of light cos(A) terms can be represented by even harmonics of w1 – i.e. 40, 80 kHz cos(B) terms can be represented by even harmonics of w2 - i.e. 44, 88 kHz sin(A) terms can be represented by odd harmonics of w2 - i.e. 20, 60 kHz The product terms sin(B)sin(A) and sin(B)cos(A) also exist, and can be represented by sum and difference frequencies of the even and odd harmonics.
Comparison with Ideal MSE • Ideal MSE without mirror imperfections can be represented as cos(A)=G1Itot +G2(Ipcos(2gp)+Iscos(2gs)) +G3(Ipsin(2gp))+Issin(2gs)) + G4Ic cos(B)=G5Itot +G6(Ipcos(2gp))+Iscos(2gs)) + G7(Ipsin(2gp)+Issin(2gs)) + G8Ic sin(A)= G9(Ipcos(2gp)+Iscos(2gs)) + G10(Ipsin(2gp)+Issin(2gs)) +G11Ic • Additionally, either Is or Ip is 0 by use of interference filters. This combination yields g quite readily. • The additional G terms arise due to imperfect mirrors with S/P reflectivities < 1 and mirror phase shifts • The complication arises when the Stoke vector changes between a calibration and a plasma • It can be demonstrated that the Stokes vector changes on C-Mod even from one plasma to the next
Counts nm Impurity Spectra M. Sampsell • Four lines (three carbon and one fluorine) observed in 6576 - 6586Å range. • Reference amplitudes determined for one shot using monochromator. In model, amplitudes scaled by edge ne or a user-input scalar. Tail of D C (I) C (II) F (III) Continuum
BES Filtered Spectra of Impurity Lines M. Sampsell • BES Filter • Measured Spectrum • C&F Impurity Lines Counts Wavelength (Å)
BES Filters at MSE Location M. Sampsell • BES Filter • Measured Spectrum • C&F Impurity Lines MSE Filter is ½ as wide as BES. Counts Wavelength (Å)
Measuring the Stokes Vector • To consider the measurement of g,we must now consider more unknowns, and their effect on the measurement. • The C-Mod MSE switched to fast digitization in 2002 to improve signal to noise, but fast digitization of the total intensity reveals much more information. • 1 MHz digitization rate • Using software lockins, we can extract amplitude information for every frequency of interest. Frequencies currently used in the analysis: • <200Hz (DC), 2kHz (w2-w1), 18kHz (2w1-w2), 20kHz (w1), 38kHz (3w1-w2), 40kHz (2w2), 42kHz (w2+w1), 44kHz (2w2), 46kHz (3w2-w1)
Measuring Geometric Constants • Each of the geometric constants must be measured using an invessel calibration. This step has not yet been performed, and will be done during the next opening • A calibration jig simulating the DNB light will be placed invessel to do in situ geometry calibration • Each term of the Stokes vector must be ISOLATED during the calibration. This is NOT possible to do using beam into gas or plasma as one does not have control over the polarization state • The following will be be input into the MSE dianostic: • Pure unpolarized light • Pure Linearly polarized light at many angles • Pure Circularly polarized light
Remotely controllable calibrated rotating filter mount. Linear/Circular polarizers. Mounted in front of first MSE lens Planned Invessel Calibration Part 1 – Simulate beam and input Unpolarized, Linearly, and Circularly Polarized light Film polarizer in frame Linear @ 0o, 90o, 10o,etc… Circularly polarized Unpolarized when removed Red LED Array at 660 nm Variable intensity Opal Glass Diffuser Attaches to beam flange commercial optical bench, circa 10 cm x 50 cm Part 2 – All channels receive identical polarization
Measuring Is / Ip using He plasma • To avoid possible ambiguities with unpolarized light from intrinsic Da leakage we will calibrate using a helium plasma, and possibly gas as well. This will measure Is/Ip for the l-mixed case, and verify that it is constant for all relavant densities (>1019m-3) • This should resolve atomics physics differences between beam into gas and beam into plasma (6560.1Å[weak], 6678.2Å) • This could also be done using high resolution spectra of beam into gas and beam into plasma (e.g. Levinton), combined with detailed transmission profiles of the interference filters. This will also be tried. • This calibration will be done during the current campaign
Beam into gas calibration • Calibration using a simulated beam is not sufficient. Other contaminating effects need to accounted for such as: • Faraday rotation induced by transmissive optical elements (requires operating field) • Stress induced birefringence (requires vacuum calibration) • Magnetic/Electric? field effects on PEM operation • Retardation can be measured directly • This calibration has already been performed in deuterium
Measuring the Retardation In Situ • Making use of the intensity formula, one can use a cross term, such as sin(A)sin(B) to determine the retardation of both PEMs • sin(A)sin(B)= cos(A0cos(w1t)) • cos(B0cos(w2t)), solve for A0, B0 • Use the usual Jacobi-Anger expansion into Bessel harmonics: • We can solve for the retardation of both PEMs using the lock-in amplitudes of the 38, 42, and 46 kHz components • This works because this harmonic family is affected identically by all geometric and intensity terms
Retardation Measurement Discussion • Retardation ratio is not constant under all conditions. • It is also not the same from channel to channel due to the cosine distribution of the retardation over the PEM aperature • This applies a multiplicative factor of J2(A’0)/J2(A0) and J2(B’0)/J2(B0) to the measured MSE lockin amplitudes when compared against calibration data • By measuring the retardation shot to shot this correction can be made to the data • About 1-3% effect (MSE components must have >99% accuracy)
Error Regression Constant • It is possible to try and use relevant changes in unpolarized intensity and circularly polarized intensities between gas and plasma to try and correct for the observed errors • D quantities are changes between plasma shots to the gas calibration shots • Unpolarized light independent of pitch angle, circular term weakly depends on pitch angle due to mirror imperfections cross terms • Significant error reduction over large number of shots supports MSE modeling Regression over many shots [>>3] Error = EFIT-MSE DIunp Reduced Error DIcirc
EFIT with MSE q profile Ohmic Sawtoothing ne20=0.72 Ip=0.8MA Core Te=2keV (Thomson)