Download
1 / 30
300 likes | 456 Views
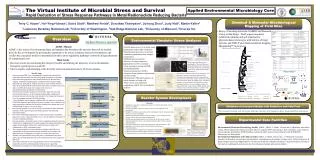
Applied Environmental Geoscience (ESE 3.22) . Dr. Bill Dudeney Room B339 RSM Department of Earth Science and Engineering E-mail a.dudeney@imperial.ac.uk. Spring term 2006 Tuesday 0900-1200 – Keynote lectures Friday 0900-1200 – Coursework One day field work at Silwood Park.

E N D
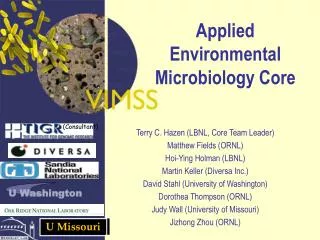
Applied Environmental Geoscience (ESE 3.22) Dr. Bill Dudeney Room B339 RSM Department of Earth Science and Engineering E-mail a.dudeney@imperial.ac.uk Spring term 2006 Tuesday 0900-1200 – Keynote lectures Friday 0900-1200 – Coursework One day field work at Silwood Park Session 2 (3 hours) – Basic microbiology
Objective Familiarity with terms and fundamentals relevant to applied environmental geoscience: • living organisms, particularly microorganisms • biomolecules as the building blocks of organisms • diversity and ecology, particularly of microorganisms
Carbon, microbes, plants, animals • Carbon comprises as little as 0.02% of the total crustal mass, yet is a fundamental component of the biosphere and the main constituent of all living matter • Numbers of different species: microbes, 2.3x10⁵; plants 2.5x10⁵; animals (mostly insects) 106 • A microbial cell weighs roughly 10-12 g (linear dimension about 1 m) but the total microbial biomass is at least 1012 tonnes • Total biomass: microbes> plants>>animals
Diagram of a bacterial cell After Lester and Birkett
Types of organisms • Viruses: infectious nucleic acid and protein • Cellular organisms*: uni- or multi-cellular with nucleus (or nucleoid), cytoplasm, cell membrane and sometimes a cell wall Prokaryotes (bacteria - unicellular) have an ill-defined nucleus (nucleoid) - archaebacteria (e.g., extreme thermophiles and methanogens) - eubacteria (most bacteria, including cyanobacteria) Eukaryotes have a true nucleus - protists (unicellular photosynthetic algae and ingestive or adsorptive protozoa) - fungi (multicellular, except yeasts, as branching filaments or hyphae; lichens are intimate associations between algae and fungi) - plants - multicellular, differentiated and photosynthetic - animals - multicellular, differentiated and (mostly) ingestive *Bacteria and fungi may be aerobic, facultative or anaerobic. Protists, plants and animals generally require oxygen for respiration (energy provision)
Dimensions • Linear 100 m- Resolving power of eye 200 m 10 - Typical eukaryote cell 1 - Typical bacterial cell 100 nm - Limit of light microscope 250 nm 10 - Small virus 1 - Biological molecules 1-10 nm 0.1 - Atoms (carbon 0.08 nm) • Surface/volume ratio Varies as reciprocal of radius – smallest organisms have (relative to volume) greatest surface and shortest diffusion distances; potentially the highest rates of nutrient uptake and waste elimination; hence the greatest rates of metabolism and growth
Microorganisms • Microscopic and numerous • Many different species • Many habitats (versatility): define limits of biosphere • Simple growth requirements: e.g., freeze-dried culture; source of energy, carbon and trace nutrients; water • Rapid growth • Great adaptability • Large impact: geology, environment, society and industry
Approximate microbial composition • Overall: biomass 25%, water 75% • Elemental: carbon, hydrogen, oxygen, roughly as ‘CH2O’, plus mineral nutrients (N, P & K) and trace elements • Biomass (associated and bonded biomolecules): proteins (enzymes, etc.), carbohydrates (sugars, etc.), lipids (fats) and nucleic acids (DNA, RNA) in various proportions – see separate sheets
Types of microbes • Autotrophs: use carbon from carbon dioxide - phototrophs use light energy to reduce carbon dioxide to organic compounds. - chemotrophs use chemical energy, e.g., from oxidation of hydrogen or ferrous iron, for the same purpose • Heterotrophs: use carbon and energy from organic carbon - oxidative organisms oxidise organic compounds* for energy - fermentative organisms use molecular rearrangement, e.g., sugar to alcohol, without net oxidation for energy *Aerobes use oxygen and produce carbon dioxide and water; anaerobes use sulphate, etc., and produce degraded organic products and sulphide, etc.
Universal phylogenetic tree BACTERIA ARCHAEA EUKARYA Green non-sulphur bacteria Methanosarcina Thermo- proteus Animals Extreme halophiles Proteobacteria Fungi Cyanobacteria Plants Ciliates Methanopyrus Hypothetical root
Examples of microbes • Autotrophs - phototrophs The unicellular green alga Chlorella vulgaris carries out oxygenic photosynthesis, as does the filamentous green cyanobacterium Oscillatoria princeps (which also fixes nitrogen) - chemotrophs The acidophilic bacterium Thiobacillus ferrooxidans: uses oxygen to oxidise ferrous iron at pH 1-3 (cells become immobilised on iron(III) oxide precipitate); the neutrophilic Gallionella ferruginea: uses oxygen to oxidise ferrous iron in near neutral medium (twisted stalk of iron(III) oxide excreted from cell) • Heterotrophs - oxidative organisms The slime-forming activated sludge bacterium Zoogloea ramigera uses oxygen to oxidise sewage organics; the anaerobic bacterium Desulfovribrio desulfuricans uses sulphate for oxidation, e.g., to oxidise lactate to acetate (and to produce sulphide) - fermentative organisms The uni-cellular fungus Saccharomyces cerevisiae (brewer’s yeast) converts sugar to alcohol and carbon dioxide anaerobically; the filamentous fungus Aspergillus niger converts sugar to citric acid aerobically
Microbial growth and stability • Microbes grow by cell division • Growth involves synthesis and organisation of biomolecules • Biomolecules are not thermodynamically stable so energy coupling is needed • Condensation (joining of two precursor molecules with expulsion of a water molecule), which is fundamental to biomolecule synthesis, may be driven by hydrolysis of adenosine triphosphate (ATP) • Thus, the overall process has a -ve free energy change • The assembly of biomolecules is kinetically stable but is subject to enzymatic hydrolysis and oxidation
Exponential microbial growth After Lester and Birkett
Mathematical description • Growth can be considered at two levels: individual and population • For microbes, population growth predominates and is theoretically exponential. A plot of LogN vs time is thus a straight line, with a slope K being the rate constant K = (LnNt – LnNo)/t h-1 From the graph (previous slide) K = 0.67 h-1 and the mean doubling time (1/K) = 1.5 h • Doubling time vary. For E. coli, S. cerevisiae and M. tuberculosis typical values are 0.35, 1.5 and 6 hours, respectively
The batch growth curve After Lester and Birkett
Typical microbial growth • Exponential growth following the 2n rule would soon convert all the world’s biomass to microbial mass, but this is prevented by nutrient starvation • Batch cultures are characterised by the so-called growth curve, which has four distinct phases: lag (acclimatisation), exponential (constant rate of cell division), maximum stationary (when at least one nutrient has become exhausted) and lysis (death) • Continuous culture may exist in both natural and industrial systems. In these cases a continuous feed of nutrients is balanced by an equal out flow of metabolic products so that concentrations of nutrients and cells achieve a steady state – see next slide
Laboratory continuous culture After Lester and Birkett
Effects of conditions in batch • Substrate concentration on - growth (next two slides) - cell yield (three slides on) • Temperature (four slides on) - thermophiles 40-80ºC - mesophiles 10-45ºC - psychrophiles 0-20ºC • pH: most species 7-8; a few 1-3 or 9-10
Effects of concentration • dN/dt = μN, where N is the instantaneous cell number or concentration and μ is the instantaneous (or specific) rate constant or growth rate (0.693K) • For batch cultures, a plot of μ vs nutrient concentration (S) forms a rectangular hyperbola consistent with the equation below (diagram in next slide). In this equation, μmax is the maximum specific growth rate and Ks is the saturation constant equal to the substrate concentration when μ = 0.5 μmax • μ is markedly affected by [S] when the latter is low, while at higher values approaches a limiting value μmax. Values of Ks are generally low in comparison with initial substrate concentrations, e.g., for S. cerevisiae Ks is 25 mg/l for glucose, even though the sugar is utilised at about 10 g/l.
Rectangular hyperbolic relationship between specific rate constant μ and substrate concentration [s] μ μ = μmax μ = Ks [s]
Effect on biomass Y = Cell yield coefficient, typically in range 0.4-0.6 After Lester and Birkett
Temperature and growth rate After Lester and Birkett
Field and laboratory techniques • Microbes typically occur in mixed populations of very small individuals. Sampling, e.g., of mud and water, is qualitatively easy but difficult to make precisely representative • Problems of enumeration, differentiation and characterisation led to the development of specialised techniques, particularly for isolation and maintenance of populations in pure culture • Aseptic conditions: use of sterilised equipment in a laminar flow cabinet; sterilisation by autoclaving (121ºC, 15 min.), filtration (0.45 μm membrane), UV light, irradiation by 60Co source or microwave oven or cleaning with disinfectants (phenol, etc.) • Inoculation and cultivation: controlled growth is established by aseptic transfer of an inoculum of a culture to a suitable growth medium (solid agar in a Petri dish or liquid broth in a flask) and allowing growth to occur under steady conditions of pH, T, atm. and agitation • A so-called streak plate is inoculated with the culture by means of a wire loop (see separate diagram) and the distributed cells allowed to grow. Towards the far end of the streak, growth may be sufficiently sparse to identify individual colonies derived from a single cell. Sampling of these and re-growth should yield a pure culture • Observation, identification, numbers and assay: optical microscopy in magnification range 100-1000 diameters; electron microscopy; matching with literature data; Gram stain and DNA sequencing. Numbers by counting (hemocytometer) or electronic image analysis; assay, e.g., by biochemical oxygen demand (BOD) as mg/l O2 consumed in 5 days
Microbial growth, dispersal, survival • Microbial growth can be so great that resources are soon exhausted • Microbes exist in situ or are dispersed to reach new resources in space and time • Bacteria are readily dispersed by air or water • Fungi are usually anchored to the substratum and produce spores that are dispersed • Cells can survive in situ either by using their reserves or becoming dormant • Some bacteria have spores that are very long-lived and resistant to adverse conditions
Environmental cycles • Energy, starting from the sun, flows through the living world until it is dissipated • In contrast, an element used by living organisms must cycle - otherwise all of the element would end up in one state and life would end • The carbon, nitrogen, sulphur and iron cyles are relatively well known. A representation of the carbon cycle is shown on the next slide • Pool sizes and flux rates are of particular interest. For instance, the atmosphere contains some 7 x 10⁸ tonnes CO2, of which about 10% is fixed each year. However, respiration and fires produce 6 x 10⁷ and 7 x 10⁷ tonnes pa, resp. This apparent imbalance is blamed for global warming
Environments • Typical environment: a pond, lake or river with underlying mud has - an aerobic zone with air as the oxidant and aerobic organisms. It may extend a few mm into the mud or, in the presence of gross organic pollution, may be altogether absent - an anaerobic zone with oxidative anaerobes and fermentative organisms. With increasing depth, and diminishing redox potential, sub-zones may exist with nitrate, sulphate and carbon dioxide acting successively as the oxidant (and nitrogen, hydrogen sulphide and methane being products), respectively Oxygen diffuses downwards and metabolic products upwards, thus becoming resources for aerobes • Extreme environments: hot springs, salt lakes and antarctic dry deserts may have extreme thermophiles, osmophiles and cryptoendolithic lichens
Microbes in geology, industry and environment • Microbes are believed to have: - played a role in the original development of life, climate change, and deposition of certain minerals - a continuing role in the present day environment and in environmental control systems - an analogous role in industrial and societal processes • These are the subjects of the next sessions