Download
1 / 21
210 likes | 376 Views
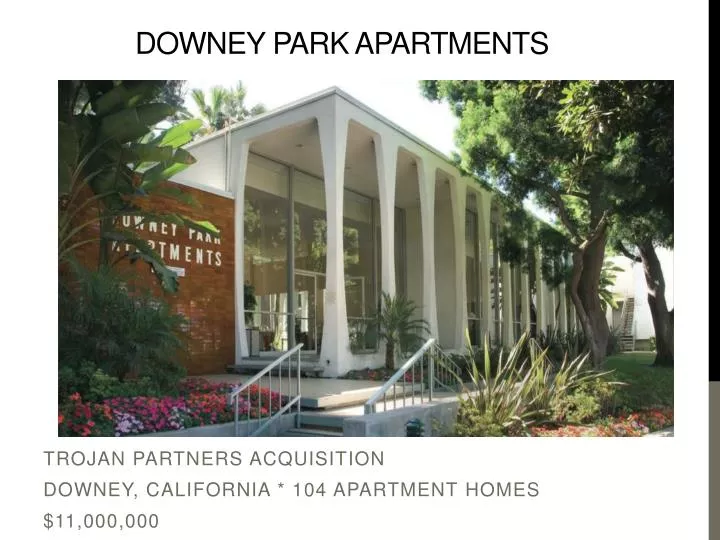
Downey Park Apartments. Trojan Partners Acquisition Downey, California * 104 Apartment homes $11,000,000. Property Profile . Property Finances. Location. Map View. Satellite view. Employment. Centrally located amid three submarkets South Bay East Los Angeles North Orange County

E N D
Downey Park Apartments Trojan Partners Acquisition Downey, California * 104 Apartment homes $11,000,000
Location Map View Satellite view
Employment Centrally located amid three submarkets South Bay East Los Angeles North Orange County Jobs: 6,780,000 within twenty-mile radius Unemployment Rate: CA (12.3%) Unemployment Rate: Downey (9.8%) Employment Projection: 2015: 52,588 2010: 48,221 2000: 44,197
Demographics U.S. Census Bureau: LA has second largest population in the United States Median Income: $59,955 Median Age: 31 Median House Value: $452,000 Average Household Size: 3.1 people
Travel Time To Work Average Commute: 25 minutes 75% Drive Alone
Transaction Summary • Purchase Price: $11,000,000 • Acquisition Cost: $330,000 • Price Per Unit: $105,769 • Total Units: 104 • Price Per Square Foot: $91 • Livable Square Feet: 120,700 • Avg. Square Feet Per Home: 1,161
Rationale High Entry Cap Rate Valuation 10% Year one Cash on Cash Return >14% Value Add Upside Cap Rate reduction 10% expected rent increase Oversized Apartment Homes: 37% larger than East LA submarket Low Interest Rate Financing
Downey Average Rents Average Rent 1x1 Unit Average Rent 2x2 Unit
Assumptions • Value Add Cost: • $700,000 • # Units Complete/yr: • 24 • Renovation Term: • 51 months • Rental Increase: • 10% • Hold Period: • 5 yrs. • Hurtle Rate: • 6% • Purchase Price: $11,000,000 • Acquisition Cost: $330,000 • Loan Fee: • $71,500 • LTV%: • 65% • Loan Amount: • $7,150,000 • Equity: • 3,850,000 • Interest Rate: • 5% • # Units: • 104 • General Vacancy: • 5% • Concessions: • 4.17% • Non-Rev Units: • 2% • Other Income: • $63,267 • Capital Reserves: • $300 • Entry Cap: • 10% • Exit Cap: • 7%
Promote Split • Trojan Partners Initial investment: • $637,725 • 15% of Equity $4,251,500 • Preference Rate: 6% • Promote Split: 70 Equity / 30 Sponsor • Acquisition Fee Charged: $110,000 • Fee covers operating overhead • $10,000 bonuses awarded to each partner
Pro-Forma Value add Returns (5 year hold with Value Add) • Going in cap 10% • Exit cap 7% • Renovation cost $700,000 or $6,000 a door • Property leveraged IRR (65% LTV) 41% • Sponsor leveraged IRR (65% LTV) 62% • 5 year sale profit $15,099,814
Justification Sales Comparables Report
The Capital Stack Sponsor: $637,725 Equity: $3,613,775 Lender: $7,150,000 Total Property Cost: $11,401,500 (Property + Acquisition Cost + Loan Fee)
Debt Coverage Ratio Loan Terms: $7,150,000, 65% LTV, 5% FRM, 10yr., Interest Only Assuming 3% Rent Growth & 2% Expense Growth Assuming Rent falls 50% Year 1: 1.42 Year 2: 1.55 Year 3: 1.69 Year 4: 1.82 Year 5: 2.07 • Year 1: 2.85 • Year 2: 3.11 • Year 3: 3.37 • Year 4: 3.64 • Year 5: 4.15
Cash on Cash Return Property CC on Sponsor CC Year 1: 19.43% Year 2: 23.74% Year 3: 28.12% Year 4: 32.56% Year 5: 755.49% SPONSOR CC IF RENTS DROP 50% • Year 1:14.81% • Year 2: 16.97% • Year 3:19.16% • Year 4:21.38% • Year 5:382.85% Year 1:9.71% Year 2:11.87% Year 3:14.06% Year 4:16.28%
5 Year Value Add Scenario Cash Flows CASH ON CASH • Year 0: -$637,725 0 • Year 1: $123,886 19.43% • Year 2: $151,392 23.74% • Year 3: $179,298 28.12% • Year 4: $207,616 32.56% • Year 5: $4,817,965 755.49%
Exit Cap Comparison Assuming 5 Year hold @ 3% Growth 7 Cap 8 CAP Sale: $19,545,205 Net: $12,307,642 IRR: 37% • Sale: $22,337,377 • Net: $15,099,814 • IRR: 41% 9 CAP 10 Cap Sale: $17,373,515 Net: $10,135,953 IRR: 33% Sale: $15,636,164 Net: $8,398,601 IRR: 29%