Download

1 / 32
320 likes | 440 Views
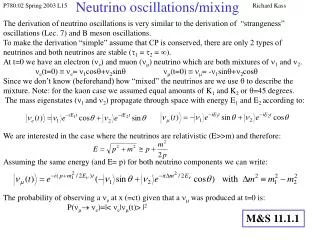
Study of neutrino oscillations with ANTARES. J. Brunner. Method : Use event ratios. MC events with oscillations. Split into Non-oscillation event rate Oscillation correction. Rate of observed events in 2 channels Can be expressed in these terms.

E N D
Study of neutrino oscillations with ANTARES J. Brunner
Method : Use event ratios MC events with oscillations Split into Non-oscillation event rate Oscillation correction Rate of observed events in 2 channels Can be expressed in these terms Analytical calculation of mixing angle for each Δm2, error propagation (stat&syst) from R Many systematic effects cancel or attenuate for R
Choose two appropriate channels • Single line events lower energy and more vertical • Multi-line events higher energy & more isotropic • Strong effect of oscillations for single line events – marginal for multiline events Elevation Neutrino Energy
E/L : differences enhanced • R1 = 0.82 (with osc/no osc) • R3 = 0.97 (with osc/no osc) • Fit mixing angle (linear) for each Δm2 for ratio R1/R3 • In practice : R3 supplies flux normalization
Track reconstruction • Good efficiency down to low energies • 20 GeV = 100m muon track for oscillation analysis • Good rejection of downgoingmuons • Reliable zenith angle resolution • few degrees • Azimuth determination / pointing accuracy • not needed
Select “hot spots” at each detector string should correspond to point of closest approach of muon track and detector line
3. Perform minimization of time/distance/amplitude related function with all selected hit using a simplified geometry obtain track parameters
Recent clean lowE single-line event Close to vertical Good fit No correlated activity in any other line
Recent clean lowE single-line event Point of closest approach Cannot be atmmuon 7 storeys hit 8 storeys high 100m = 20 GeV Total signal: 17 p.e.
Data sample • 4 years of ANTARES data taking 2007-2010 • 2007 : 5 lines active • 2008-2010 : 10,11,12 lines active • Use Physics runs which fulfill basic quality criteria • Total active time : 830 days
Multi-line event selection • Cuts are chosen for extremely high purity against atm contribution • Final cuts Fit Quality<1.3 && sinθ<-0.15 (8.6º below horizon) • Vary MC input: water parameters & angular DOM acceptance • Data/(+)MC between 0.97 to 0.815 • compatible with flux uncertainty and total detector acceptance tolerance • Numbers are for 2008 only here sinθ<-0.15 tchi2<1.3 data 491 MC 504603 MC 1.23.5 cut cut
Multi-Line Events for Full data set • 1518 Event candidates in total • Neutrino Oscillation: reduce sample by 3.3% • Muon impurity ~1% • MC 14% high for all years within statistical fluctuations • Reminder: Absolute normalisation cancels in event ratio • Following plots: MC scaled by 0.857
Single Line Event Selection2007-2010 • Nstorey>7 : hard cut to suppress muons • tchi2<0.95 • tcosth > 0 (upward going)
Single Line Event Selection2007-2010 • Nstorey>7 : hard cut to suppress muons • tchi2<0.95 • tcosth > 0 (upward going)
Single-Line MCYear by Year • Muon impurity ~5% • Neutrino oscillations • 18% reduction • Suppression of ~90 events • Corresponds to ~4-sigma effect w.r.t. statistical error (23 events)
Systematic error & Selection Stability • Method • Use both “Test” MC & “average” MC • MC1 : “low count” MC • MC2 : “high count” MC • MCm : “average” MC with MCm = (MC1 + MC2)/2 • Consider Multi-Line and Single-Line Selection • Vary Fit quality cut around chosen value • Evaluate ratios X = MC1 / MCm for various cuts • Evaluate double ratios XML / X1L • Systematic error from variations of XML / X1L
Systematic error Single Line Sample Fit quality cut varied Multi Line Sample Fit quality cut varied
Systematic error Single Line Sample Simulated Muon Rates Multi Line Sample Simulated Muon Rates
Systematic error Single Line Sample Simulated Neutrino Rates Multi Line Sample Simulated Neutrino Rates
Systematic error Single Line Sample 18% between MC1 & MC2 9% variation to MCm Very stable against cut variations Multi Line Sample Variation w.r.t. average MC Very stable between single-line and multi-line sample cancellation of systematics in R confirmed !
Systematic error • Consider all 25 combinations of single-line and multi-line cuts • Plot double ratio • XML / X1L • Distribution well centered around 1 • Spread totally contained within 3% • Propose 3% as conservative syst. error • Ratio of Ratios • 25 entries • XML / X1L
Results Single-line events • Assuming “standard” oscillations, coherent data/MC ratio of 0.86 • Larger year-by-year fluctuations for 1L due to smaller statistics • Ok within statistical error Multi-line events Data R = 472/1518 = 0.311+/-0.019 (stat&syst) MC Non-Osc: R = 636/1837 = 0.346 Non-oscillation hypothesis at 1.8 sigma from measured ratio
Results Single-line events • Assuming “standard” oscillations, coherent data/MC ratio of 0.86 • Larger year-by-year fluctuations for 1L due to smaller statistics • Ok within statistical error Multi-line events Data R = 472/1518 = 0.311+/-0.019 (stat&syst) MC Non-Osc: R = 636/1837 = 0.346 Non-oscillation hypothesis at 1.8 sigma from measured ratio PRELIMINARY
Example result from MC • Active time 2007-2010 : 830 days (220 days with 5 lines only) • Assumed true values: Δm2=2.4 10-3 eV2 & max. mixing • Reachable 1-sigma precision in Δm2 for maximal mixing 33% N1/N2 : 5.7% Δm2 : 33% Best fit 1 sigma 90% C.L. 1 sigma
Result • 1-sigma in Δm2 for maximal mixing: 1.4-3.0 10-3 eV2 • Δm2=2.2 +/- 0.8 10-3 eV2 • Active time 2007-2010 : 830 days (220 days with 5 lines only) • Non-oscillations excluded at 1.8 sigma N1/N2 : 6.1% Δm2 : 36%
Result • 1-sigma in Δm2 for maximal mixing: 1.4-3.0 10-3 eV2 • Δm2=2.2 +/- 0.8 10-3 eV2 • Active time 2007-2010 : 830 days (220 days with 5 lines only) • Non-oscillations excluded at 1.8 sigma N1/N2 : 6.1% Δm2 : 36% PRELIMINARY
Next steps • Go from event ratio to fit of E/L distribution • Even better: 2-dim grid in E versus L • Further cleaning of low Energy sample from atmospheric muons needed Differential Effect of oscillations well visible Find magic cut to get rid of this 15 30 45 GeV
Tau Neutrino appearance ? • Cascade-like events effectively suppressed • 17% branching ratio into muons • Nutau CC cross section much lower • Negligible effect for present analysis